


|
Working with Load Plan Visualization
When you join, append, or transform tables, the resulting table displays in the table selector of the Prep Data window as follows:
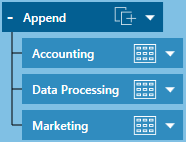
Figure 4-73. The Load Plan of a table resulting from join, append, or transform operations.
Clicking on
the  icon of the main table minimizes
the table display as follows:
icon of the main table minimizes
the table display as follows:

Figure 4-74. The minimized table display.
The tables that display under a joined, appended, or transformed table (i.e., the “parent” tables) enable you to visualize which specific tables were employed to obtain the newer table (i.e., the “child” table). This functionality is called load plan visualization.
Because joins, appends, and transforms are NOT recorded as changes, these operations will not display in a table’s change history and you may be unable to recreate child tables easily, especially when working with the same workspace at a later date. Load plan visualization addresses this issue by allowing you to recreate new tables from previously existing ones: you’ll know exactly which tables to use and what operation to apply to obtain a desired table.
Note that when pre-existing tables are combined to create new ones, the former are displayed below the latter.
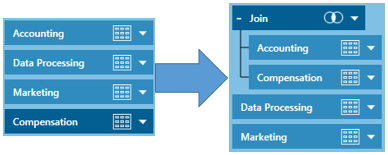
Figure 4-75. Movement of tables in a load visualization plan.
As with any other table in the Prep Data window, clicking on the drop-down icon located to the right of child tables allows you to edit the operation and pin and refresh the table. You can also rename or close the table, duplicate the table (including all other tables used to achieve it), and discard the operation. In case of the latter, the child table disappears and only the parent tables remain.