The Curve Editor is a pop-up window that helps you view and modify graphed curves in a more intuitive and holistic way than the individual XY Plots panels.
Location: From the menu bar, select Setup > Curve Editor.
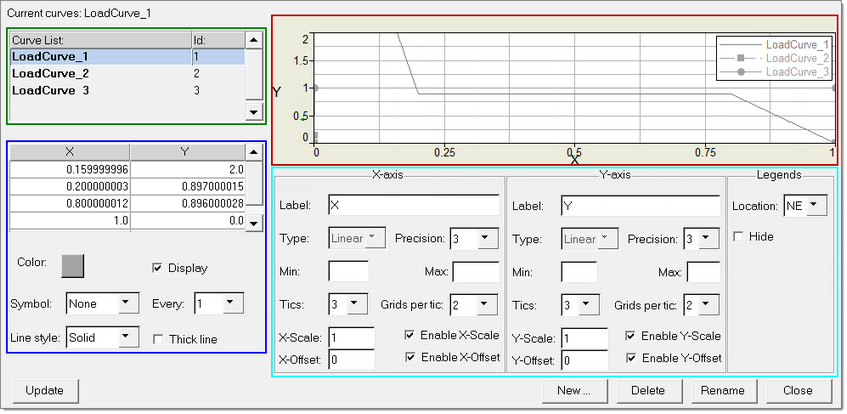
The Curve Editor contains four main areas as you see outlined in color in the following image: curve list (green), curve attributes (blue), graph area (red), and graph attributes (cyan).
Note that changes made in the Curve Editor are automatically sent back to HyperMesh, but changes made in a HyperMesh panel do not automatically get sent to the Curve Editor. For this reason, if you leave the Curve Editor open while making changes in HyperMesh, you must update the Curve Editor to import the changes:
| • | Changes made in the Curve Editor immediately affect HyperMesh. |
| • | Changes made in HyperMesh do not immediately affect the Curve Editor, and must be imported. To import changes, from the Curve Editor, click the Update button. |
To quit the Curve Editor, click Close. Note that any changes you make in the Curve Editor are automatically applied as you make them and will be retained.
How do I…
| 1. | Click the desired curve in the curve list. |
The curve’s attributes fill in the fields in the curve attributes area.
| 2. | Modify the curve attributes if needed. |
| 3. | Click the display checkbox in the curve attributes area. |
The curve displays in the graph area.
|
| 1. | Click the curve that you wish to modify |
| - | Either click the curve in the curve list |
Or
| - | Click the curve in the graph area, if it is already set to Display. |
| 2. | Make any desired changes to the curve’s attributes: |
| - | Modify each X and/or Y value by clicking it, pressing the <delete> key to erase the current value, and then typing in a new value. |
| - | Change the Color by clicking the colored box. A list of available colors displays; click the desired color to select it. |
| - | Click the display checkbox to toggle the display of the curve in the graph area. |
| - | To place a marker symbol at each point on the curve, select a symbol from the list box. |
| - | To change the symbol spacing, select a number from the every: list box. |
For example, if you choose "3" then only every third point will display as a symbol.
| - | Select a Line style to change the curve’s line from solid to dotted, or show no line at all. |
Note: if you choose no line, the line’s symbol points will still display.
| - | To draw the curve in a thicker line, click the thick line checkbox. |
|
| 1. | In the graph attributes area, modify the fields inside the X-axis frame: |
| - | Type in a new label to change the graph’s X-axis label. For example, you could change it from "X" to "Acceleration". |
| - | Select a precision to change the number of decimal places that display in the numbers on this axis. |
| - | Choose a min and max to restrict the graph to a specific range of values. For example, even if your data included accelerations ranging from 0 up to 10 m/s2, you could restrict the X axis to only graph accelerations from 1 to 5 m/s2. |
| - | Change the number of Tics and Grids per tic to control how fine the grid behind the curves is drawn. |
| - | The number of Tics indicates how many evenly-spaced, numbered increments display between the beginning and end of the axis. For example, if your data ranges from values of 0 to 2.0, setting Tics to "3" produces three increments (at 0.5, 1.0, and 1.5). |
| - | The Grids per tic sub-divides each tic, making a finer grid, but these grid lines are not numbered (much like the fractional markings on a ruler). |
| 2. | Modify the fields inside the Y-axis frame: |
| - | Type in a new label to change the graph’s Y-axis label. For example, you could change it from "Y" to "time". |
| - | Select a precision to change the number of decimal places that display in the numbers on this axis. |
| - | Choose a min and max to restrict the graph to a specific range of values. For example, even if your data included accelerations from 0 seconds to 60 seconds, but you only wish to graph the accelerations that occur between 30 and 35 seconds, you could restrict the range by typing "20" into the min and "35" into the max. |
| - | Change the number of Tics and Grids per tic to control how fine the grid behind the curves is drawn. The number of Tics indicates how many evenly-spaced, numbered increments display between the beginning and end of the axis. For example, if your data ranges from values of 0 to 2.0, setting Tics to "3" produces three increments (at 0.5, 1.0, and 1.5). The Grids per tic sub-divides each tic, making a finer grid, but these grid lines are not numbered (much like the fractional markings on a ruler). |
| 3. | Modify the fields inside the Legends frame: |
| - | Select a location to determine where the legend displays in the graph area. |
| - | Click the hide checkbox to toggle the display of the legend on and off. |
|
| 1. | Click the New… command button in the Curve Editor window. |
| HyperMesh temporarily supplants the Curve Editor and prompts you to specify a name for the new curve. |
| 2. | Type in a name for the new curve. |
| HyperMesh returns you to the Curve Editor. |
| 4. | Click the new curve in the curve list and modify its attributes as needed. |
| For example, type in the X and Y coordinates for each data point in the curve. |
|
| 1. | In the curve list, click the curve that you wish to delete. |
| 2. | Click the Delete command button. |
A confirmation window displays.
| 3. | Click Yes to confirm the deletion, or No to keep the curve. |
Undo
You cannot undo a deletion; once you delete a curve, you cannot recover it.
|
| 1. | Click the desired curve in the curve list. |
HyperMesh temporarily supplants the Curve Editor and prompts you to specify a new name for the chosen curve.
| 2. | Type in a new name for the curve. |
HyperMesh returns you to the Curve Editor, which now uses the curve’s new name.
|
See also
Setup


