Manufacturing Solutions

FLD Plots

FLD Plots

Previous topic Next topic Expand/collapse all hidden text  

FLD Plots

Previous topic Next topic JavaScript is required for expanding text JavaScript is required for the print function  

User Profiles:

Incremental_LS-DYNA

RADIOSS One Step

To access, select fld plots on the main page to use this panel.

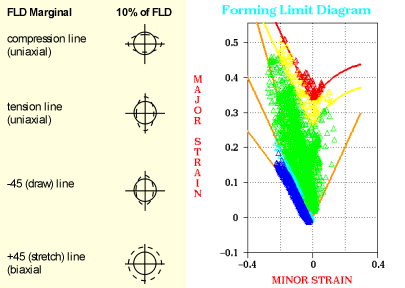
FLD plots allow you to determine the areas of the model at which failure may occur.  Typically, elements above the FLD curve are considered to fail by splitting.


How do I...

expand-green-10View FLD Plot options
1.Activate one or more of the check boxes to display different viewing options:

fldplot

2.Select an element in the model to highlight the corresponding point in the plot.

The location on the plot, element ID, and number of points in the plot are displayed on the panel.

3.Select a point on the plot to highlight the element in the model, and display the location on the curve, element ID, and number of points in the model on the panel.
4.Click FLD contour to locate the different zones relative to the FLD curves.

A color contour of the model relative to FLD is displayed.  Red indicates failure by splitting zones, yellow indicates marginal or potential failure by splitting zones, dark blue indicates high wrinkle potential zones, light blue indicates moderate wrinkle potential zones, and  green indicates safe zones.  The different zones are described under the color contour legend.


expand-green-10Create an FLD plot
1.Click the FLD Plots panel.

project= should point to the current project name with the complete path.

2.By default, all components used for analysis should be selected for FLD plots.  You may choose to deselect some of the components from the comps selection.
3.Click create FLD.

The FLD plots, with the elemental major and minor strains, are plotted with all of the associated curves (FLD marginal, compression line, tension line, -45 (draw) line, and +45 (stretch) line).  All of the components selected will be displayed with one FLD plot per component.  The plots are arranged on the graphic window in the order of the component IDs from the top, upper right-hand corner downwards.

The colors of the plotted points on the FLD (corresponding to element major and minor strain), are based on their relative position with respect to the FLC as follows:

Color

Description

Red:

All points above the FLC

Yellow:

All points between the FLC and the "FLC marginal"

Green:

All points between the "FLC marginal" and the "-45 (draw) line" and the "+45 (stretch) line"

Light Blue:

All points between the "-45 (draw) line" and the "compression line"

Dark Blue:

All points on the left-hand side of the "compression line"

The model with the displayed components is resized so that it does not overlap with the FLD plot area.


expand-green-10Create an FLD contour
1.Click FLD contour.
2.The formability contour is displayed for all selected components.  You may choose to deselect some of the components from the comps selection.  All of the components selected will be displayed with the formability contour along with the corresponding FLD plots.  The smoothed out colors of the elements are based on their strain levels with respect to the FLC as follows:

Color

Description

Red:

All points above the FLC

Yellow:

All points between the FLC and the "FLC marginal"

Green:

All points between the "FLC marginal" and the "-45 (draw) line" and the "+45 (stretch) line"

Light Blue:

All points between the "-45 (draw) line" and the "compression line"

Dark Blue:

All points on the left-hand side of the "compression line"


The legend below describes the regions corresponding to the different colors as follows:

Color

Description

Red:

Failure

Yellow:

Marginal_F

Green:

Safe

Light Blue:

Marginal_W

Dark Blue:

Wrinkle


expand-green-10View the interactive results display between the FLD plot and contour
1.After creating the FLD plots and contour, click on the model.  The element at the cursor location and the plotted point corresponding to it under the FLD are highlighted.
2.Click on a point under an FLD plot.  The plotted point at the cursor location and the element corresponding to that plotted point are highlighted.


See also

Alphabetical List of Panels