Variability (Stochastics) Study
Study the effects of parameter variations on squeak and rattle issues.
The manufacturing of parts is often related to variations of tolerances and quality of materials. Also, the assembly process adds a set of variations on dimensions and connection of stiffnesses resulting in a unique product at the end of each build. These two major processes contribute to the quality and performance of the final product.
Squeak and Rattle are phenomena that are tightly related to the quality of the built parts, and performance can vary through the population of produced products.
%20Study.png) Figure 1.
Figure 1. - Prepare the FE model for analyzing Squeak and Rattle issues.
- Setup variability study for the following-
- Material Parameters
- Attachment Stiffness
- Thickness, and
- Damping
- Run analysis and post-process the results.
- Use a fresh model and prepare the model analysis setup. For this workflow, refer the following sections from Detailed Risk and Root Cause Analysis:
- Import a model with Dynamic Event loadcase. For this workflow, you can use the model with solver deck created in the Detailed Risk and Root Cause Analysis usecase along with the Dynamic Loadcase.
Choose the workflow according to your need and refer to sections mentioned above for the procedures.
Files Required
Files required to complete the usecase.
Step 5: Variability Study Setup and Export
Define variability study setup for various parameters and export the solver deck.
Variability Study Setup
Below are the steps to setup variability study(s).
-
From Setup group, select Variability
Study.
 Figure 2. A guide bar will appear.
Material Parameter Study- Youngs' Modulus
You will setup a variation study for all the materials in the model.
-
Using window selection in the graphics area, or click
 in the guide bar to open advanced selection
option. Select all the materials from the list.
This selects five materials in the model. A microdialog appears.
in the guide bar to open advanced selection
option. Select all the materials from the list.
This selects five materials in the model. A microdialog appears. Figure 3.
 -
Select E from the list, enter
20 for
 and
and  value fields.
This defines the parameter variation percentage for the study. Click
value fields.
This defines the parameter variation percentage for the study. Click to expand the microdialog. You can define a
desired name for the study or retain the default.
to expand the microdialog. You can define a
desired name for the study or retain the default.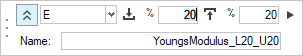 Figure 4.
 -
Click
 .
This creates the material Youngs' Modulus (E) variation study.
.
This creates the material Youngs' Modulus (E) variation study.
Material Parameter Study- Density
-
Using window selection in the graphics area, or click in the guide bar to open advanced selection
option. Select all the materials from the list.
This selects five materials in the model. A microdialog appears.
-
Select RHO from the list, enter
20 for and value fields.
This defines the parameter variation percentage for the study.
-
Click .
This creates the material Density (Rho) variation study.
Attachment Stiffness Study
-
Click in the guide bar to open advanced selection
option.
-
Click .
This creates the Attachment Stiffness variation study.
Material Thickness Study
-
Retain the default values in the microdialog and click .
This creates a study for the material Thickness variation study.
Damping Study
-
Click in the guide bar to open advanced selection
option.
-
Click .
This creates the material Damping variation study.
To review variability study
-
Select Review Variations.
 Figure 5. A table will appear containing all the variations and its related parameters. Click Close after verification.
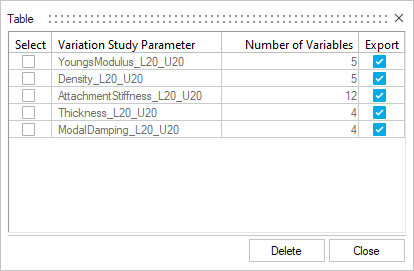 Figure 6.
Export Solver Deck
-
From Analyze group, select Export
OptiStruct Solver File.
 Figure 7. Model Export window will appear.
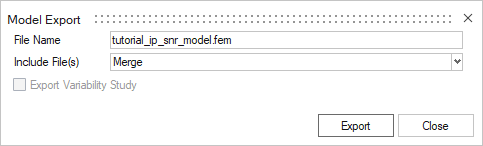 Figure 8.
 -
Check Export Variability Study box.
Variability Study properties are displayed.
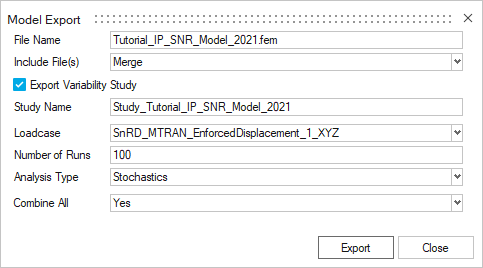 Figure 9.
TPL template
file to solve on HyperStudy. Step 6: HyperStudy Database Generation
- TPL,
- XML
The template (TPL) file us created with the required parameters that are readable by HyperStudy.
Stochastics Runs
Below are the steps to generate results database and summary files. These files will be later used in SnRD Post-processing.
-
Once the XML file is loaded, a session tree will populate in
HyperStudy and the process will start from
Sto 1 node.
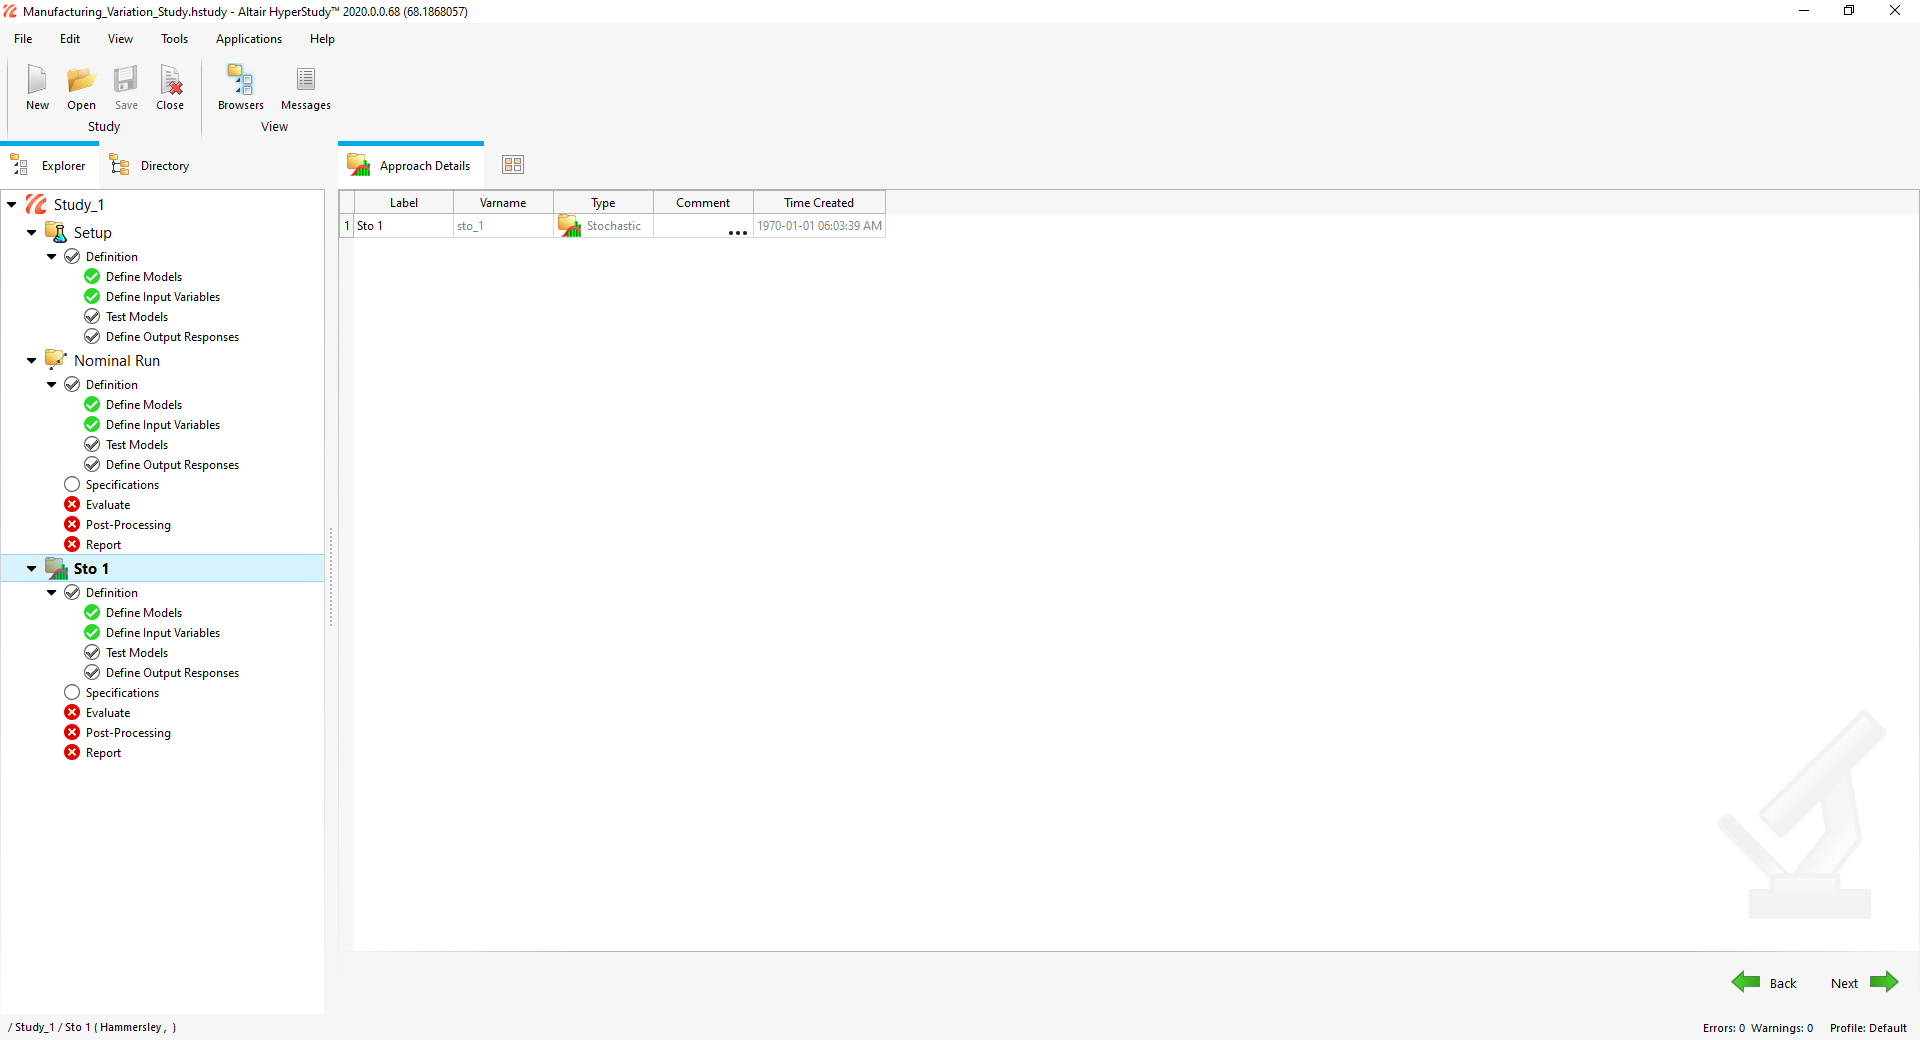 Figure 10. Note: Green check boxes signify that the respective data is available. Any Yellow, Red or empty boxes mean inputs are required.
 -
Click Next
 to proceed to task.
Note: You can skip Define Models and Define Input Variables tasks since they are pre-defined.
to proceed to task.
Note: You can skip Define Models and Define Input Variables tasks since they are pre-defined.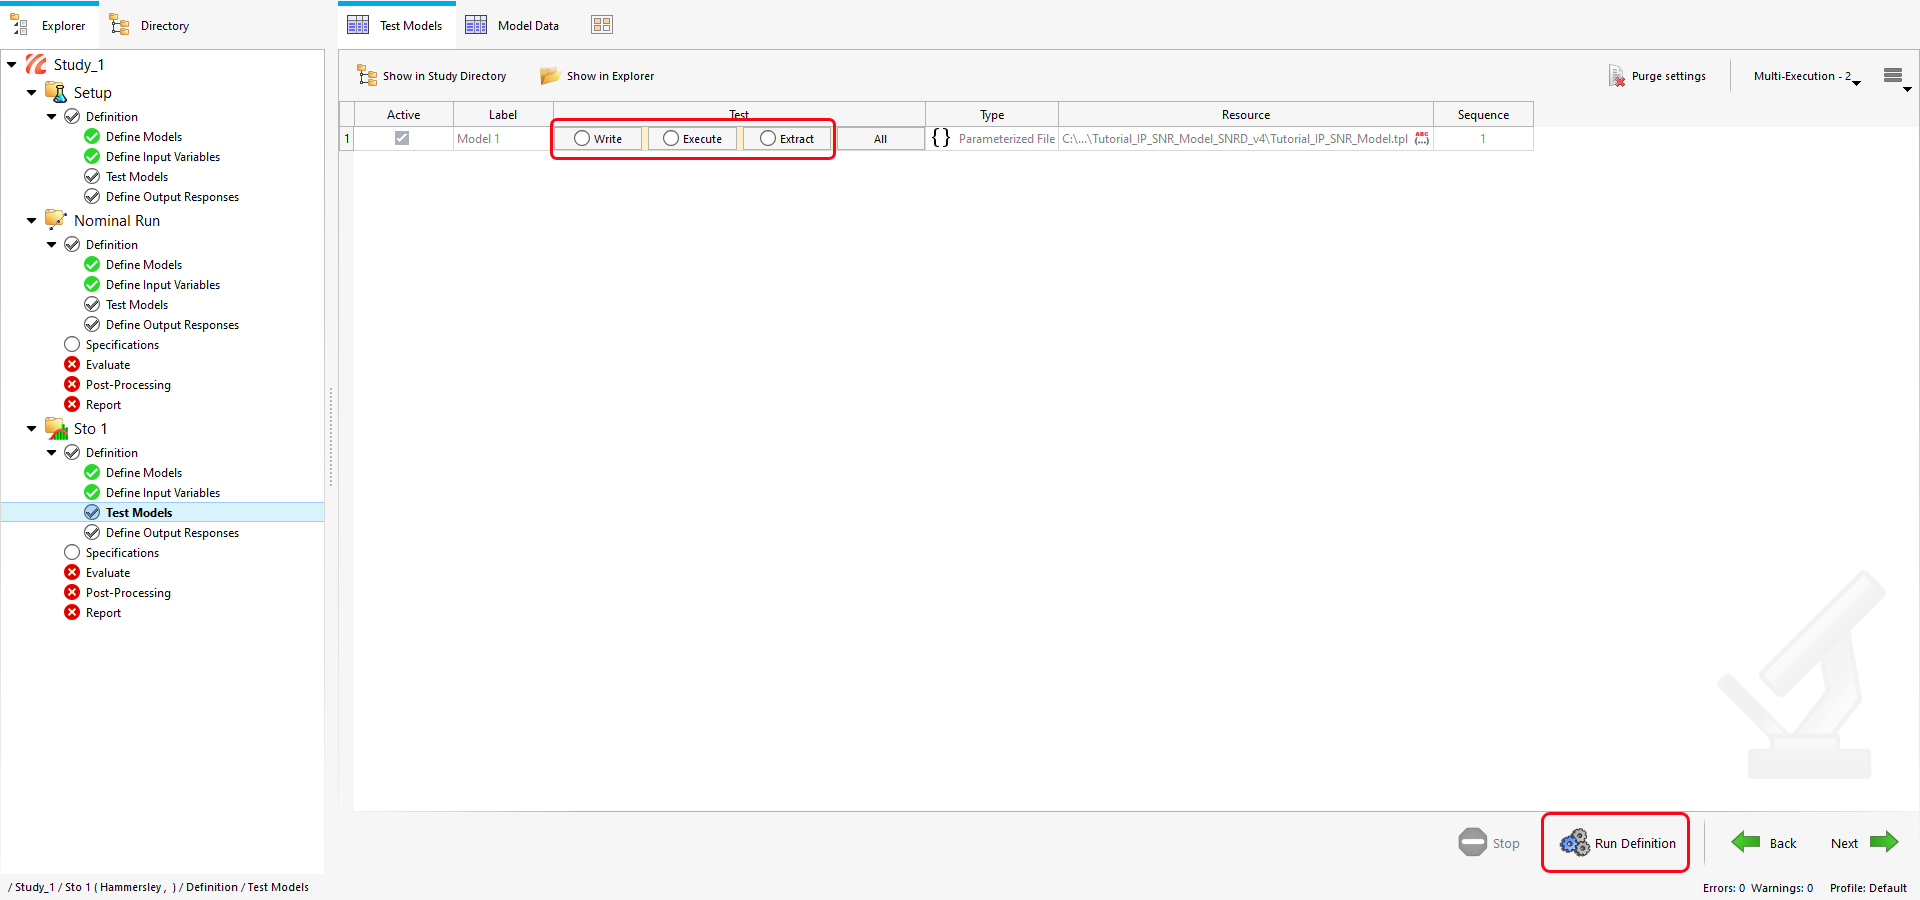 Figure 11.
 -
Click Next
to proceed to Define Output
Responses and click
Evaluate.
-
Click Next
to proceed to
Specifications and click
Apply
 .
.
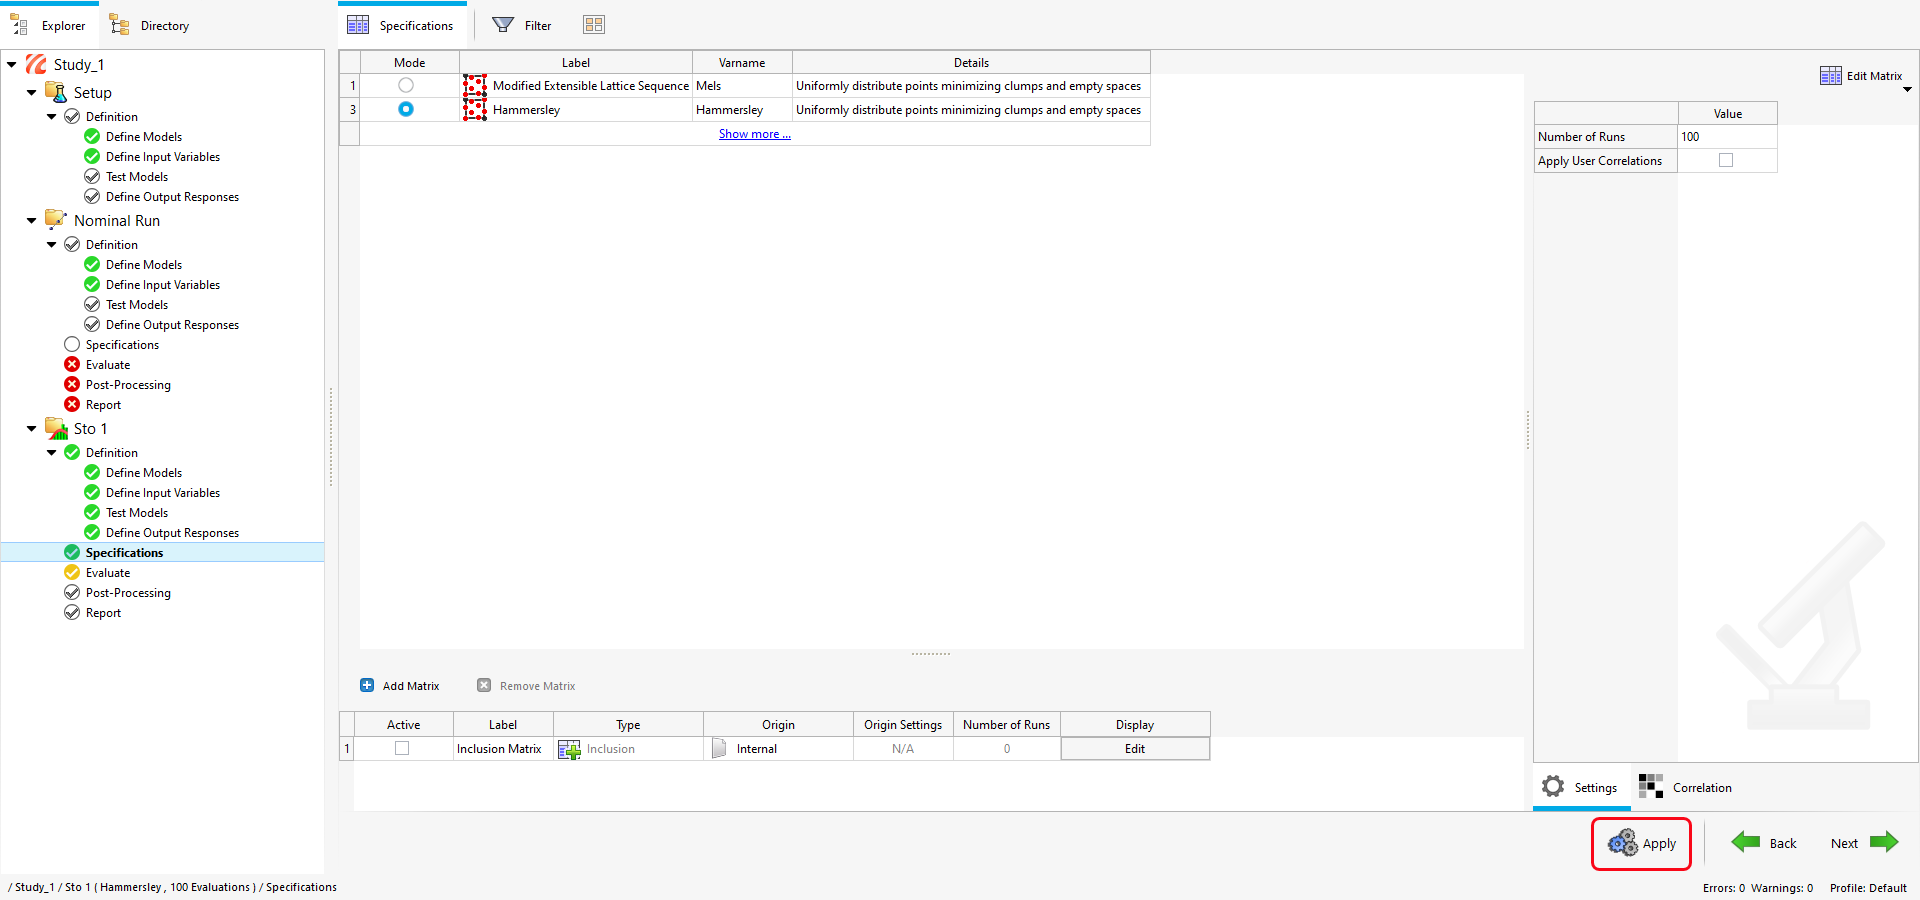 Figure 12.
 -
Click Next
to proceed to
Evaluate.Click
Evaluate
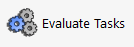 to run the stochastics variations.
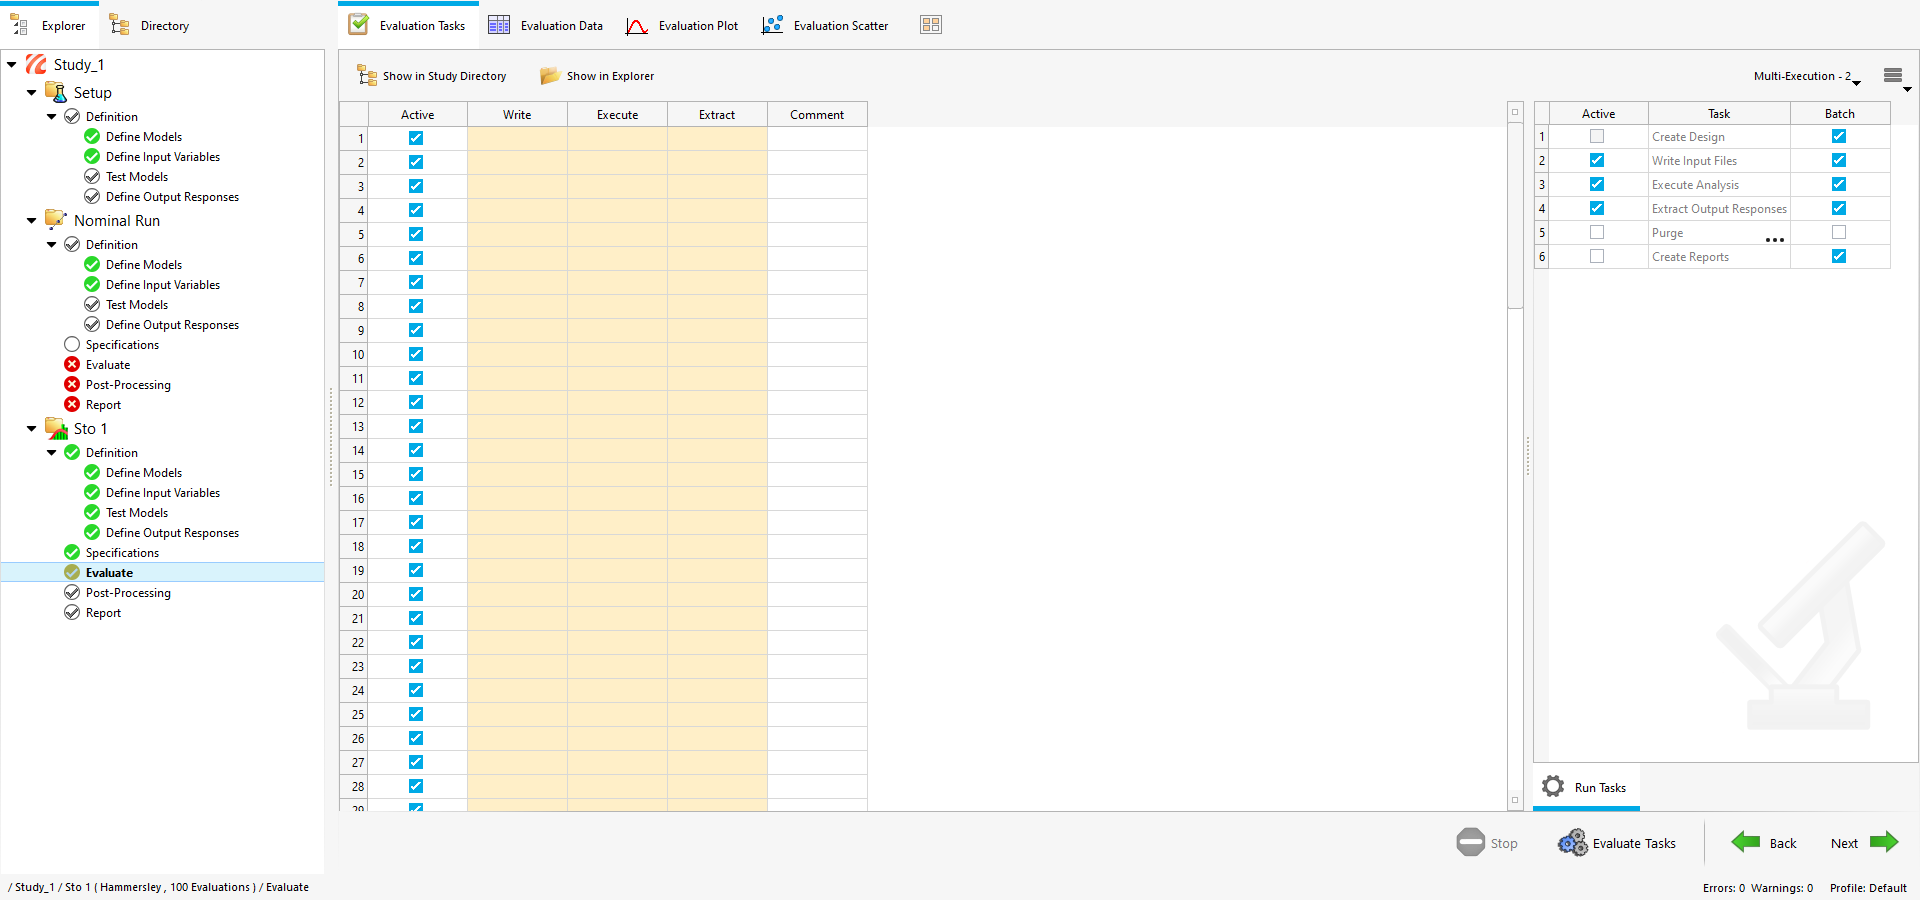 Figure 13. Note: Evaluation tasks will take considerable amount time to complete. Please do not interfere with HST when the process is running.
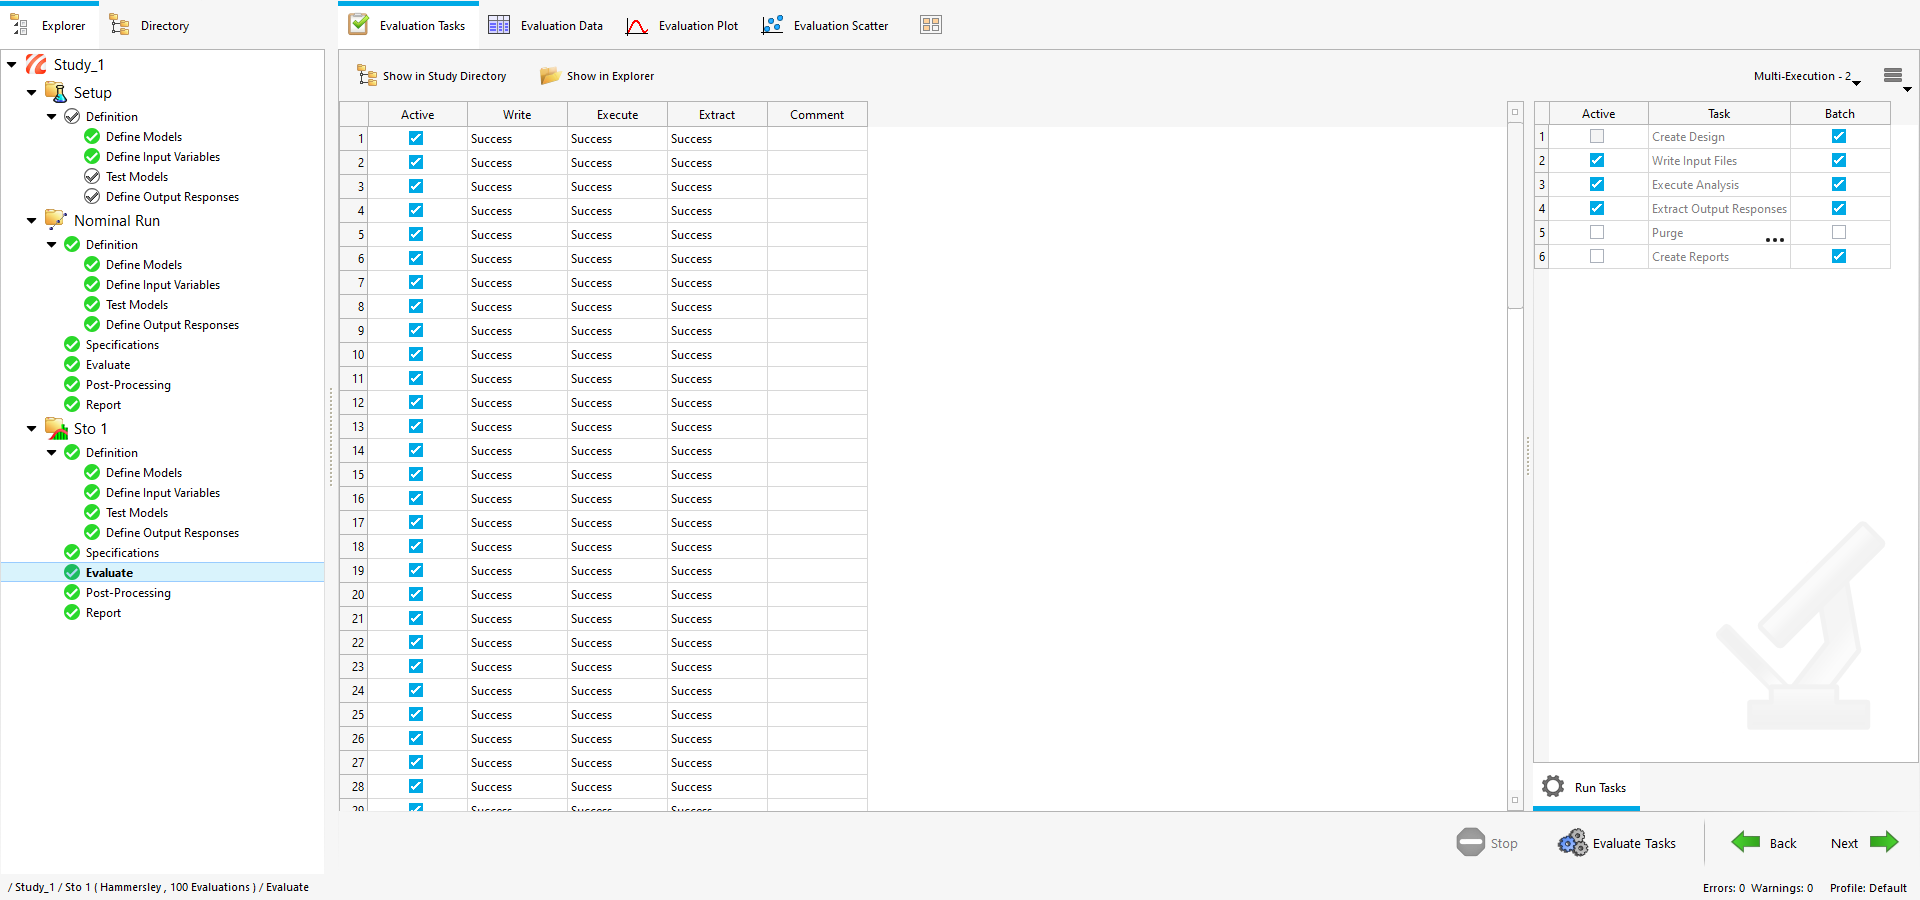 Figure 14.
 Once the evaluation is completed, remaining tasks, I.e Post-processing and Report turn green.
-
Click Next
twice to skip
Post-processing and navigate to
Report task.
-
Click Create Report
 .
This generates a
.
This generates a.datafile, which will be the results database that will be utilized later in SnRD Post.You can navigate to Tutorial working model folder and verify the files. The respective files will be created in the export folder.
Tip: Learn more about Altair HyperStudy.
Step 7: Stochastics Post Processing
summary.data files created which were created in the after Create Report steps from HyperStudy,
to .-
Select .
SnRD Post Processing tool is launched.
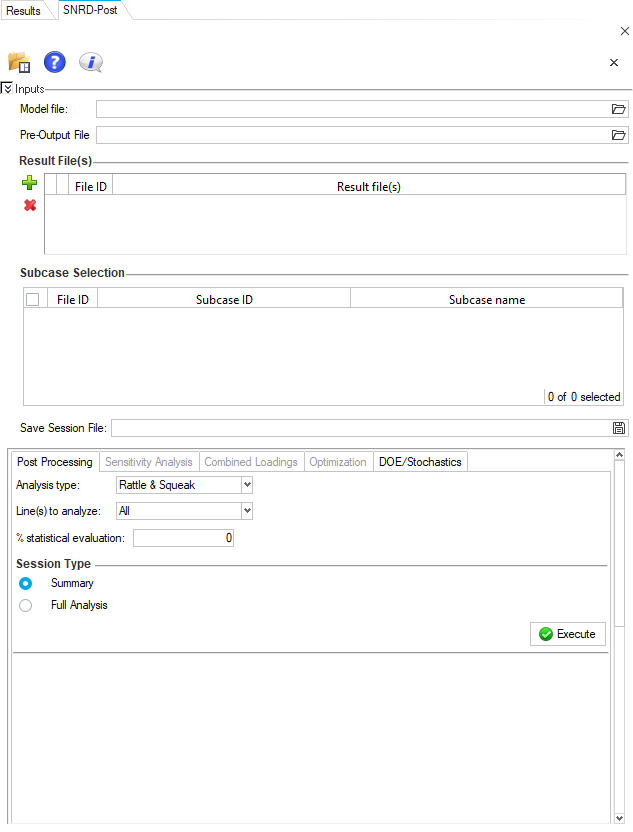 Figure 15.
 -
Using the file browse option
 , select the OptiStruct solver file which
was exported in Step 4 for Model File.
Note: Pre output CSV file containing the E-Lines definition is sourced automatically.
, select the OptiStruct solver file which
was exported in Step 4 for Model File.
Note: Pre output CSV file containing the E-Lines definition is sourced automatically. -
Click
 against HyperStudy Results
Database. A file browser window will appear.
against HyperStudy Results
Database. A file browser window will appear.
-
Click Calculate
 .
This will start the Compose 2021 in the background to perform the stochastics runs evaluation.Note: Since the number of runs is high, a considerable amount time will taken. Please do not interfere with process.
.
This will start the Compose 2021 in the background to perform the stochastics runs evaluation.Note: Since the number of runs is high, a considerable amount time will taken. Please do not interfere with process. -
Once the calculation is complete, a confirmation message will be
displayed.
 Figure 16.
 Click OK to close the message.
Note: To run the results processing for the second time, you can use the SnR Database XML that was created during the calculation can be utilized. -
Click Apply Filters
This will filter all the runs in the Run Selection table
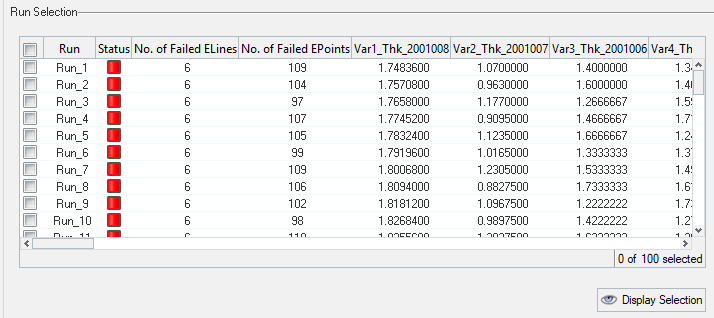 Figure 17.
Run & Display Selection
-
Click Display Selection. This will plot the results
for the selected runs.
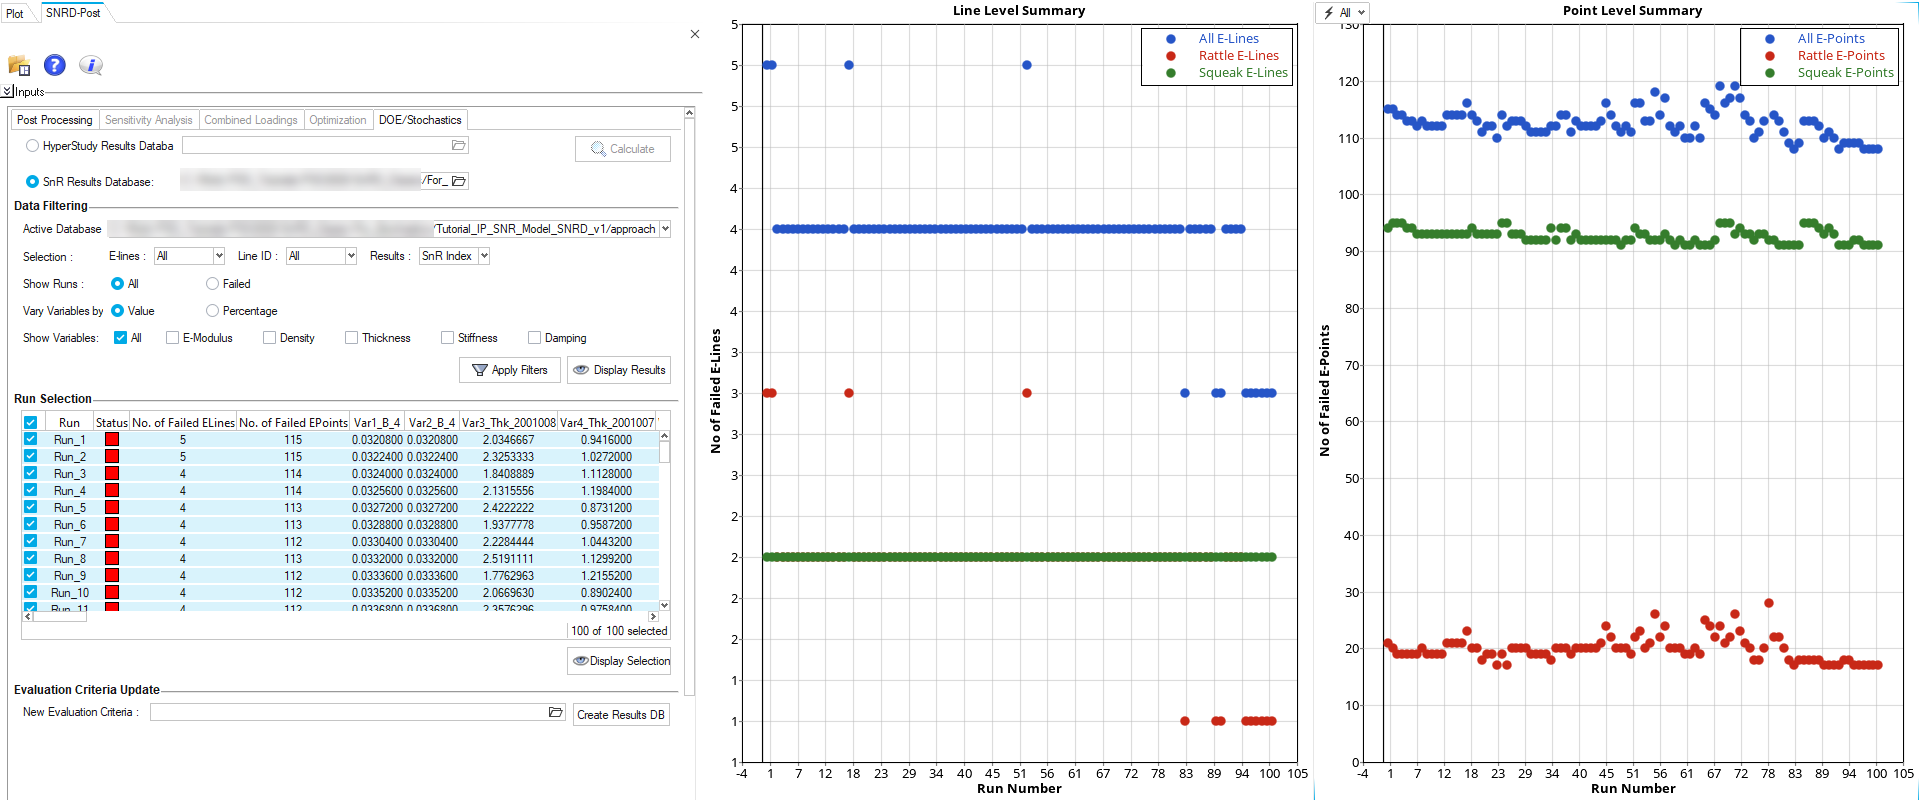 Figure 18.