Using the Application Macro

Execute the application macro in POSTFEKO to plot characteristic mode quantities on Cartesian graphs.

  1. Start with a POSTFEKO session containing at least one model with characteristic mode analysis results.

The results from a single characteristic mode analysis request will be used as input to the macro.

  1. Execute the Plot characteristic modes application macro in POSTFEKO to plot the characteristic modes.


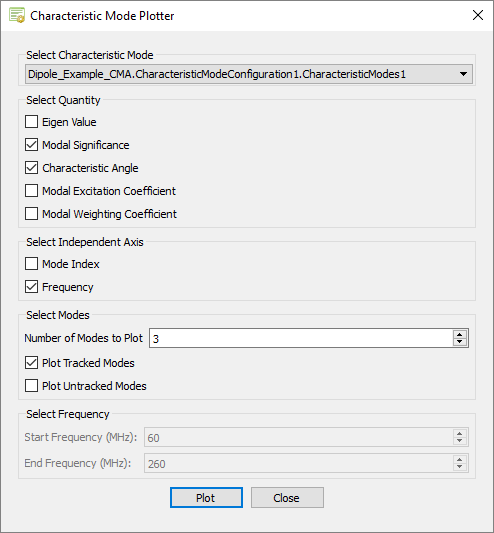
    Figure 1. The Characteristic Mode Plotter dialog.
    A dialog shows the available characteristic mode results.
  2. Select the result and quantities of interest.
    Restriction: The Modal Excitation Coefficient and Modal Weighting Coefficient can only be plotted when the model contains a source and the modal excitation coefficient calculation is enabled in the request.
  3. Select Frequency, Mode Index, or both as the independent axis.
    A new graph for each selected independent axis will be created for each quantity of interest.
  4. Enter the highest mode index to be considered. This determines the number of modes that are plotted on each graph.
    A trace is added to each graph for each calculated mode with an index lower or equal than the entered value.
  5. Select to plot either the Tracked Modes, the Untracked Modes, or both.
  6. Select Plot to start the plotting on a Cartesian graph.
  7. View the graphs generated by the macro.


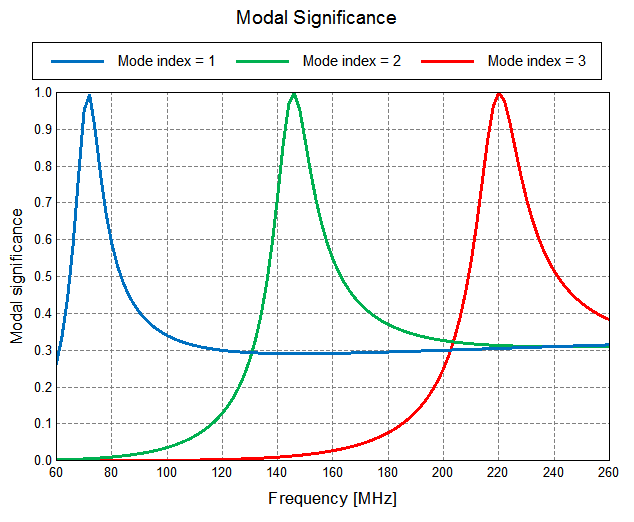
    Figure 2. Modal significance graph for a simple dipole antenna.


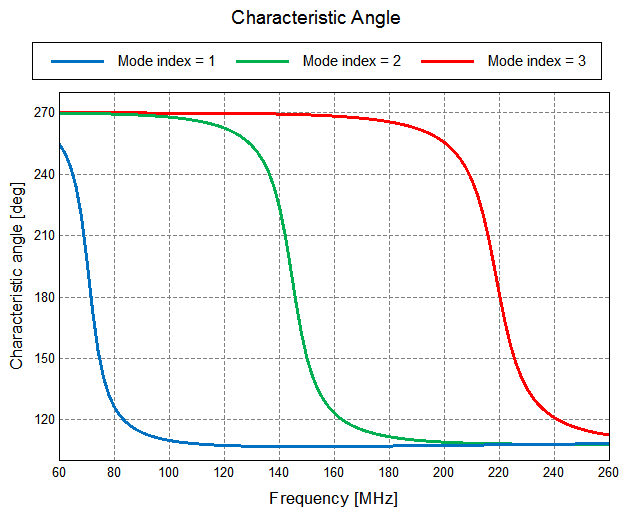
    Figure 3. Characteristic angle graph for a simple dipole antenna.


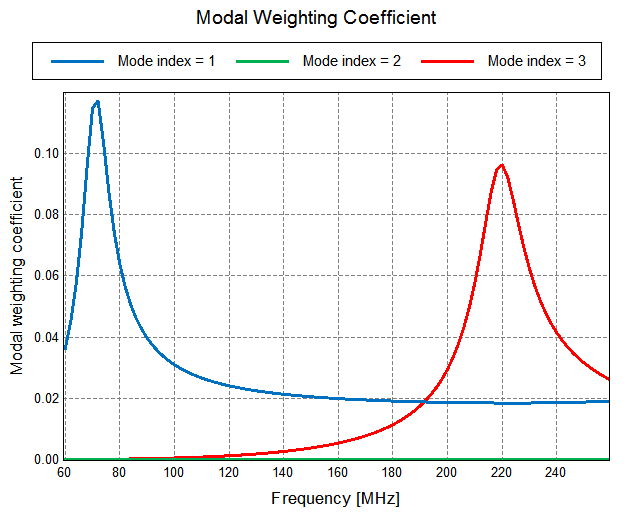
    Figure 4. Modal weighting coefficient graph for a simple dipole antenna.