Viewing the Input Impedance
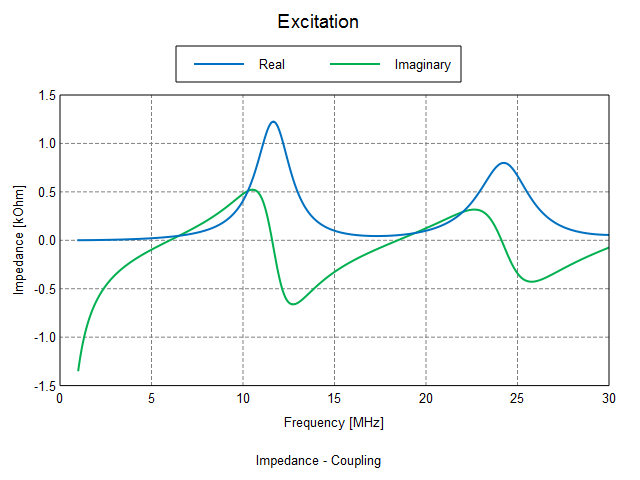
View the source input impedance (real part and imaginary part) of the transmission line on a Cartesian graph.
Create a new Cartesian graph.
-
On the Home tab, in the
Create new display group, click the
 Cartesian icon.
Add the source input impedance to the Cartesian graph.
-
On the Home tab, in the
Add results group, click the
 Source data icon.
View the real part of the impedance.
-
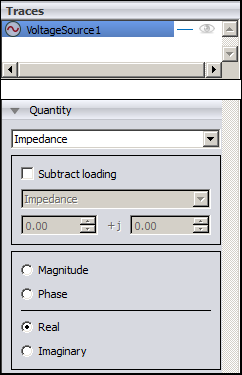
On the result palette, in the traces panel, select VoltageSource1.
-
On the quantity panel, click Real.
-
On the quantity panel, click Real.
Duplicate the VoltageSource1 trace.
-
Duplicate a trace using one of the following workflows:
- On the Cartesian context tab, on the
Trace tab, in the Manage group, click the
 Duplicate trace icon.
 - On the result palette, a right-click context menu is available on the trace. From the drop-down list, select Duplicate trace.
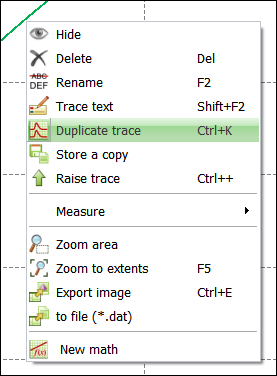
- Press Ctrl+K to use the keyboard shortcut.
A duplicate trace with the label VoltageSource1_1 is created. - On the Cartesian context tab, on the
Trace tab, in the Manage group, click the
View the imaginary part of the impedance.
-
View the load impedance (real and imaginary) versus frequency.