Fixed Tick Count: Overrides the strip chart’s grid tick division.
X Division and Y Division: Specifies values for the X Divisions and Y Divisions boxes. The numbers you enter indicate the number of grid ticks on each axis.
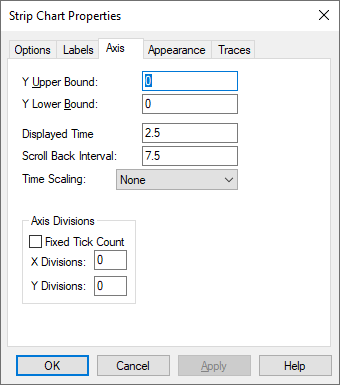
Displayed Time: Indicates the number of units to be displayed in the strip chart window at any given time. The default value is ¼ of the total simulation time.
Scroll Back Interval: Indicates how much data (in X units) is saved for examination. To conserve memory, keep this value low. To retain more data points, but use more memory, raise this value. The default value is the total simulation time.
Time Scaling: Specifies x-axis scaling in microseconds, milliseconds, seconds, minutes, hours, and days. When you select a different time axis scale, Embed re-calculates the values in the X Upper Bound and X Lower Bound boxes. When you close the dialog box, the x-axis is scaled to the time you chose.
Y Upper Bound and Y Lower Bound: Specify the upper and lower bounds for the y-axis. These bounds are in effect when you activate the Fixed Bounds parameter in the Options property sheet.