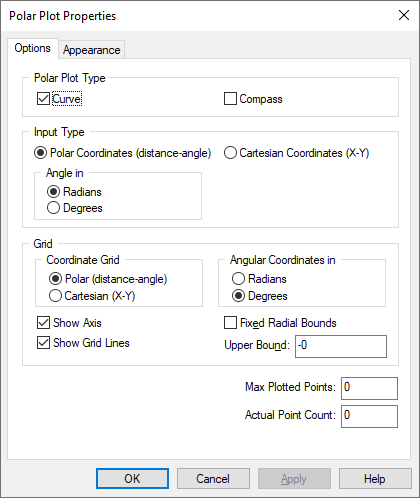
Actual Point Count: Displays the number of data points plotted.
Lets you define the polar grid. You can choose the Coordinate Grid (Polar or Cartesian) and the Angular Coordinates (Radians or Degrees).
Fixed Radial Bounds: Specifies the region of the polar plot you want to view. When Fixed Radial Bounds is activated, Embed uses the Upper Bound value as the radial boundary.
Show Axis: Displays the axis upon which the polar plot is drawn.
Show Grid Lines: Displays the polar grid lines.
Cartesian Coordinates (X-Y) / Polar Coordinates (distance-angle): Specifies the input type. If you select Polar Coordinates, you can express the angle in Radians or Degrees.
Max Plotted Points: Determines the smoothness and accuracy of the polar plot. The more data points you plot, the smoother and more accurate the plot. However, increasing the number of plotted data points also increases the time it takes to print and display the plot. Entering 0 plots every data point. The maximum number of data points that can be plotted is 250 million.
If you know the maximum number of data points you want plotted in all your plots, you can set it, as the default as described under Setting simulation defaults.
You can select both Curve and Compass to plot both the signal trace and the vector.
Compass: Plots vector arrows emanating from the origin.
Curve: Plots a trace of the signal.