Block Category: Signal Consumer
Description: The histogram block shows how data are distributed over the course of a simulation. At each time step, a data point is placed in a bin that corresponds to a specific range. You can select the number of bins and the maximum and minimum bin value for the histogram. You can also select the maximum displayed bin height or have the histogram block dynamically rescale the bins as the data points. The bins are spaced equally between the minimum and maximum bin values.
You might want to change the size or shape of the histogram block for better viewing. You can expand it to full screen size with the maximize button in the upper right-hand corner of the histogram or you can drag the histogram’s borders or corners to adjust its size.
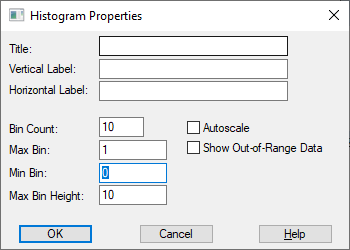
Autoscale: Rescales plot when the maximum bin height is exceeded.
Bin Count: Indicates the number of bins. If you change the bin count, the bin values are reset. The default is 10.
Horizontal Label: Specifies a horizontal axis label.
Max Bin: Indicates the maximum value of the data. The default is 1.
Max Bin Height: Indicates the maximum height of the bin. The default is 10.
Min Bin: Indicates the minimum value of the data. The default is 0.
Show Out-of-Range Data: Places data that falls below the lowest bin in the lowest bin, and places data that falls above the highest bin in the highest bin.
Title: Specifies a title for the histogram.
Vertical Label: Specifies a vertical axis label.