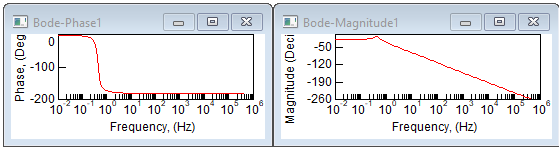
The Frequency Response command lets you set the phase and gain margins before displaying the Bode phase and magnitude plots, like the ones shown below:
Both plots are relative to log frequency (in rad/s units). The magnitude units are log and the phase units are degrees.
Before you generate Bode magnitude and phase plots of a system, prepare the system for linearization.
To generate Bode magnitude and phase plots
1. Choose Analyze > Frequency Range to define the range and resolution of the natural
2. Choose Analyze > Frequency Response to set the phase and gain margins and create the Bode phase and magnitude plots.