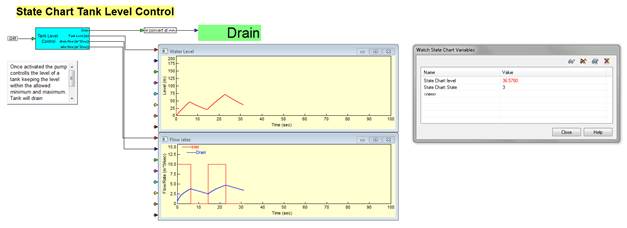
This simple example illustrates the Watch State Chart Variable panel using the draining tanks model. In this model, the state machine controls the tank level.
1. Click Examples > Applications > StateCharts.
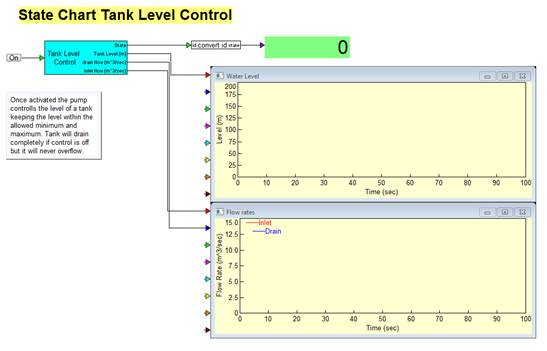
2. Click on stateChartTank.
The StateChartTank model is opened.
3. Click State Charts > Quick Watch to open the Watch State Chart Variables panel.
4.
Click  .
.
The Select Variable window appears.
5. Select the variable named level.
6. Click OK, or press ENTER.
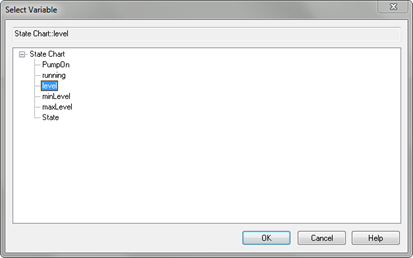
The variable level is added to the Watch State Chart Variables panel.
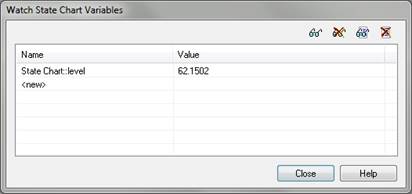
7. Repeat steps 4-6 to add the variable named state.
8. Start the simulation.
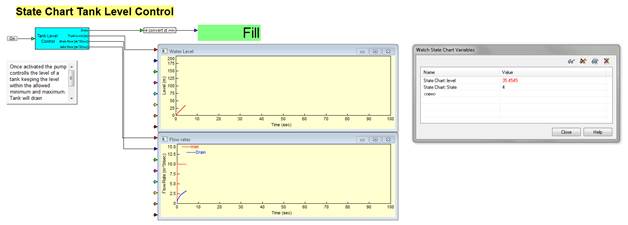
9. Click the On/Off button block to toggle pumping and draining states and visualize the water level in the plot, as well as monitor the level and state values in the Watch State Chart Variables panel