You can activate a status bar and crosshairs in root locus plots to track and display data along the real (x) and imaginary (y) axes, and the root locus gain (K).
When you select a point in the left-half plane (to the left of the imaginary axis), the status bar also displays the natural frequency (w) and damping ratio (z). If you select a point in the right-half plane, the damping ratio and natural frequency parameters are not displayed in the status bar. In this situation, the parameters are meaningless performance measures for unstable systems. If you select a point off the loci, the point on the loci nearest the selected point is used.
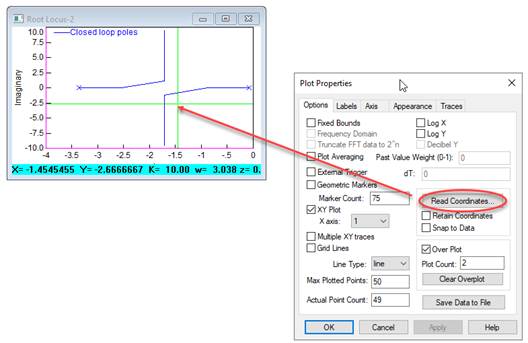
To activate the crosshairs and status bar
1. Right click over the root locus plot.
2. Under Options, click Read Coordinates.