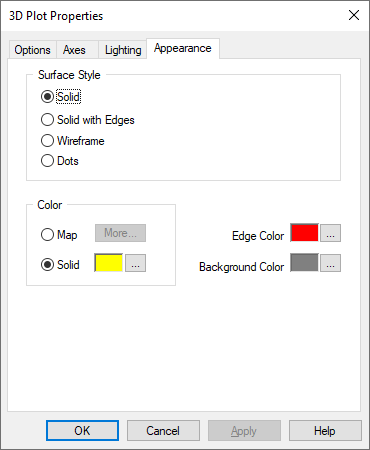
If you select a surface plot, you use the Appearance property sheet to control the surface style and color, the background color of the plot, and the edge color.
Background Color: Specifies the background color of the plotting window. To choose a new color, click … and make the appropriate selections in the Color dialog box. Click OK when you are satisfied with your selection. The color you chose is previewed next to Background Color.
Map: Applies a spectrum of color. To choose the saturation and lamination of the colors, click More and make the appropriate selections in the Mapping Color Setup dialog box. Click OK when you are satisfied with your selection.
Solid: Applies a solid color. To choose a new color, click … and make the appropriate selections in the Color dialog box. Click OK when you are satisfied with your selection. The color you selected appears in the box to the left of the … button.
The following are examples of different surfaces depending on the Enable Diffuse Light and Surface Color settings:

Enable Diffuse Light is activated. Surface Color is set to solid yellow.

Enable Diffuse Light is de-activated. Surface Color is set to solid yellow.

Enable Diffuse Light is activated. Surface Color is set to Map.

Enable Diffuse Light is de-activated. Surface Color is set to Map.
Edge Color: If you selected a Surface with Edges plot style, you specify the color of the edges (that is, the mesh superimposed over the plot) with Edge Color. When you click … to the right of the Edge Color box, the Color dialog box appears that allows you to choose a color, its hue, saturation, and lamination, as well as create a custom color. When you are satisfied with the color, click OK to return to the Appearance tab. The color you selected is displayed next to Edge Color.
The following are examples of different surfaces depending on the Enable Diffuse Light and Surface Color settings:

Enable Diffuse Light is activated. Surface Color is set to solid yellow.

Enable Diffuse Light is de-activated. Surface Color is set to solid yellow.

Enable Diffuse Light is activated. Surface Color is set to Map.

Enable Diffuse Light is de-activated. Surface Color is set to Map.
Dots: Generates dots in place of surface vertices. The following is a data point 3D plot of half a Klein bottle:

Like with the surface, surface with edges, and wireframe plots, you can change the light and color characteristics to change the appearance of the plot.
Solid: Generates a solid surface 3D plot.
Solid with Edges: Generates a solid surface 3D plot with a mesh wiring superimposed over it. You specify the mesh dimensions in the Mesh parameters under the Options tab. You can also save the mesh to file with Save Mesh to File, also contained in the Options tab.
To set the color of the mesh, use Edge Color, as described later in this section.
Input to a surface with edges plot can be matrix, data points, or surface matrix. The following are solid surface with edges 3D plots, the first has matrix input, the second has data points, and the third has surface matrix:


Wireframes: Generates a wireframe surface. Input can be matrix, data points, or surface matrix. The following is a wireframe 3D plot of half a Klein bottle:
