As models become more complex, the processing and display of model outputs becomes a significant consumer of screen space, often requiring several levels of hierarchy to process and display time history and other information. Due to this, it is convenient to create a special debug diagram from your source diagram:
The purpose of the source diagram is twofold:
•To simulate the software that will be executed on the target
•Once the simulation is acceptable, to create the executable code that will be downloaded to the target
The purpose of the debug diagram is threefold:
•To download and run the executable code
•To dynamically adjust parameters in the executable code as it runs on the target using sliders and other signal producers on the host
•To record and process data from the target and present it on the host
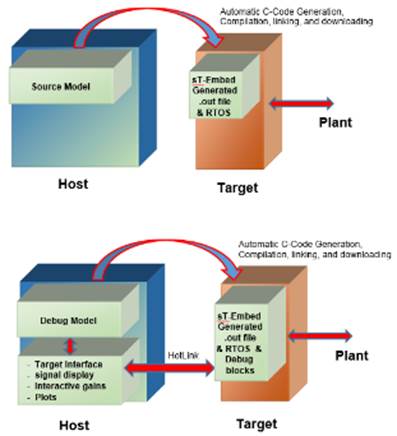
The source and debug model functions are shown below.
You create a debug diagram from your source diagram by:
•Saving the source diagram with “-d” appended to the file name.
•Replacing the compound block from which you generated the executable code with a Target Interface block. The pin labels on the Target Interface block will be populated with the pin names from the compound block.
When you simulate the debug diagram, the Target Interface block automatically downloads the OUT or ELF file to the target and starts running it. While the target executable runs, you can communicate with the target via the inputs and outputs on the Target Interface block. Note that because the target always runs in real-time, the debug diagram is configured to run in real-time mode when communicating with the target. That way, Embed is in sync with the target.