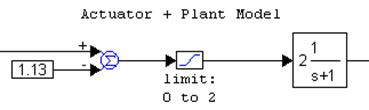
The key elements to capture in the fan-paddle model are the response profile and the lag between the input and output signals. In other words, when the input changes by a certain amount, how long does it take for the output to show the effects of the change in the input and how do the input and output amplitudes correlate. Based on this approach, subtract the 1.13V that were added in the PID controller as the minimum bias voltage for the motor to run. The remainder is limited to be in the range zero to two. The time delay and response profiles can be modeled easily by a first order transfer function using the transferFunction block, as shown below.
Because the potentiometer converts angular motion into equivalent voltage and the calibrating voltage measurements for 0o and 90o are known, modeling the sensor is a simple arithmetic operation. The complete model for the fan-paddle-sensor subsystem is shown below.
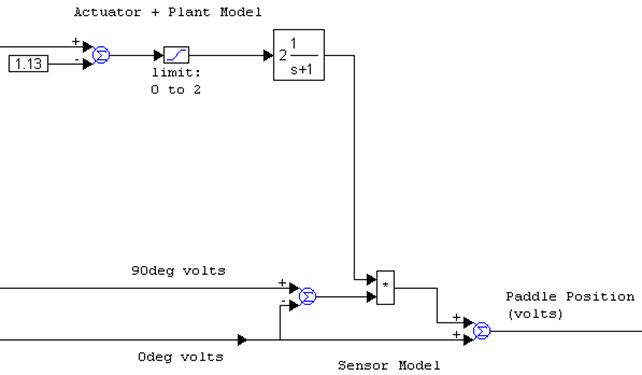
This set of blocks is encapsulated in a compound block named Fan-Paddle-Sensor Model (ACTUATOR+PLANT+SENSOR). In the dialog box for the System > System Properties command, set the range of the simulation to be zero to 100 with a step size of 0.01. A slider block with range set to zero to 30 is used to specify the set-point angle, and a plot block is used to display the results. Two const blocks are used to specify the 0o and 90o calibration voltages of 1.17 and 0.68, respectively.