|
Treemap
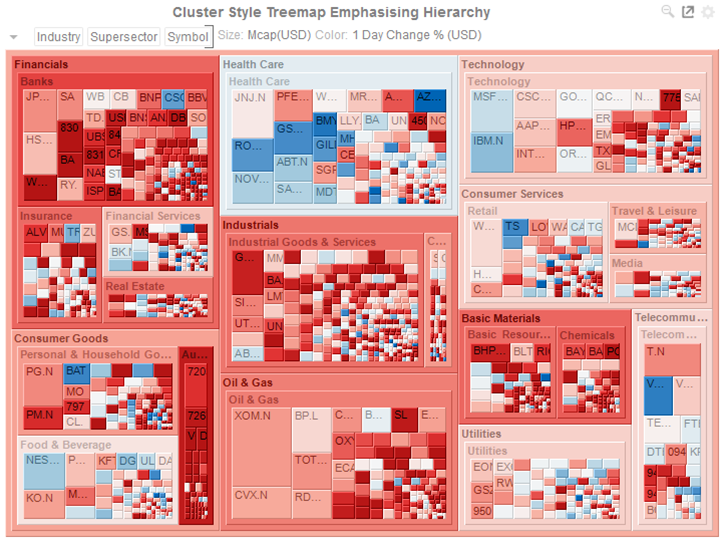
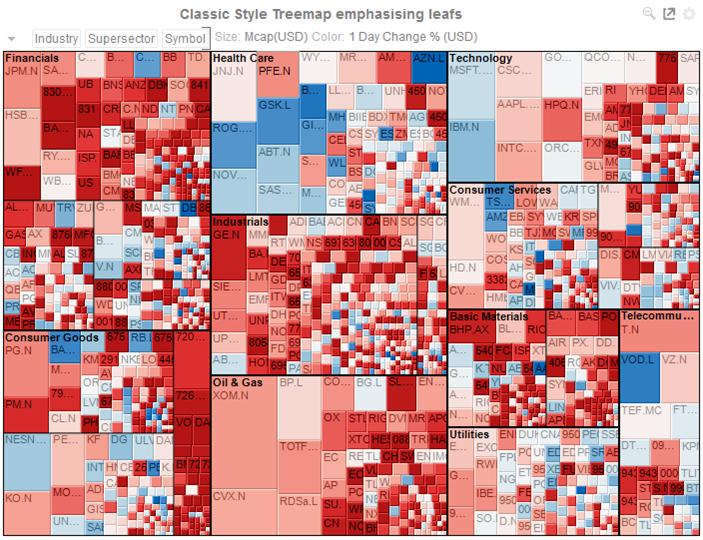
Treemaps represent hierarchical data sets, showing both each level in the hierarchy and how they interact with each other.
They are represented by a colorful mosaic of rectangular cells based on your data. The size of a cell reflects its importance. The color conveys urgency or variance:
-
White - Target/Benchmark Performance
-
Red - Under Performance
-
Blue - Over Performance
The intensity of the red or blue shades indicates the level of under- or over-performance.
Most people can learn to understand the information presented in a Treemap in under a minute – even if that Treemap is showing data representing an underlying data set of thousands of records.
Our Treemaps are not static pictures. The real value of the visualization is quickly apparent when you interact with the data. Users can zoom, filter, and view details on demand, as well as link to and highlight other sources of information. For example, fund managers can link to a trading system directly from within the Treemap.
Panopticon Designer (Desktop) supports three different styles of Treemaps:
-
Classic Style Treemaps
-
Cluster Style Treemaps