|
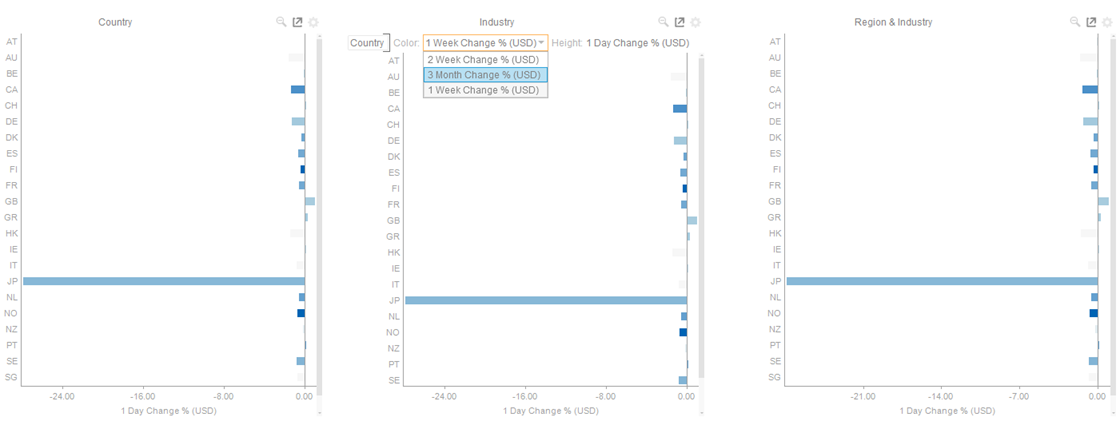
Synchronization of the Shared and Visible Variables in the Visualizations of a Dashboard
Set the Synchronization
-
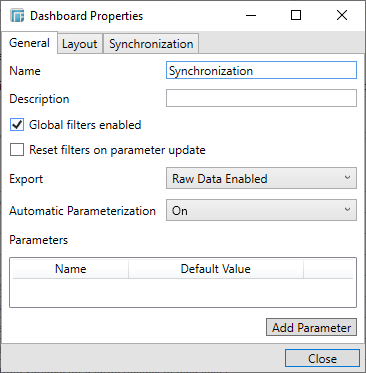
Right-click on a dashboard tab and select Properties in the context menu. The Dashboard Properties dialog displays.
-
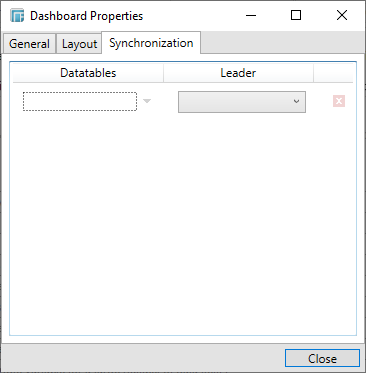
Click the Synchronization tab.
-
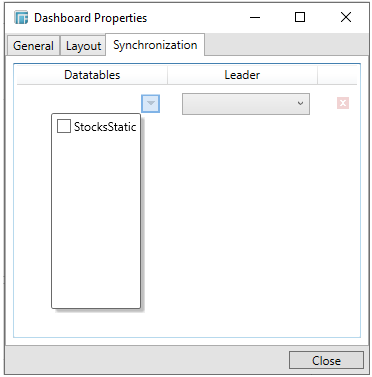
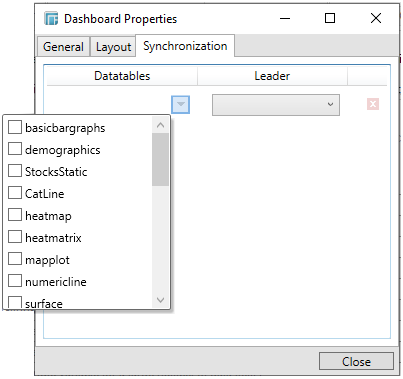
Click the Datatables drop-down button. All of the available data tables in the workbook are displayed in the list.
Example 1: Only the Example – Stockstatic data table is available
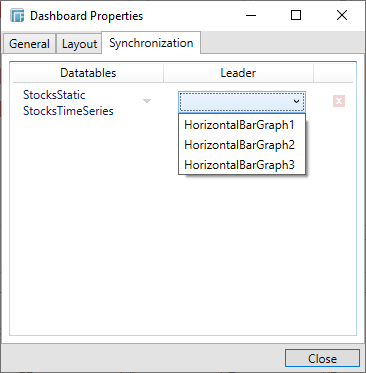
Example 2: Several data tables are available
-
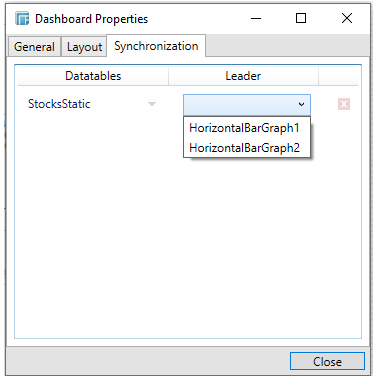
You can opt to select one or more data tables and then click the Leader drop-down button.
Example 1: The available visualizations in the dashboard using the selected data table are displayed
Example 2: All of the available visualizations using the two selected data tables are displayed
-
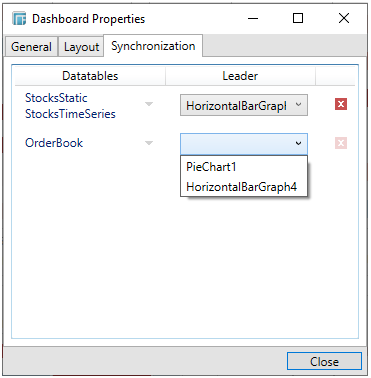
Select the Leader visualization.
NOTE: The Shared and Visible variables of this visualization will be the basis for the follower or dependent visualizations.
You may opt to define more leader visualizations for the other data tables in the dashboard.
Delete
a leader visualization by clicking  .
.
-
To define the shared variables of a leader visualization, click its settings
 icon.
The corresponding Properties
dialog displays. Click the Synchronization
tab:
icon.
The corresponding Properties
dialog displays. Click the Synchronization
tab:
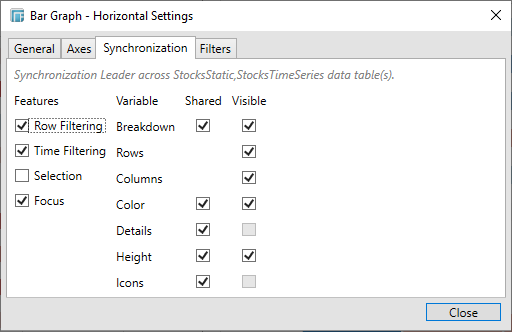
It is indicated at the top section of the tab that this will be the basis for the shared and visible variables across the selected data table(s).
For the Follower visualizations, the leader visualization to which it will be synchronized into is indicated as well.
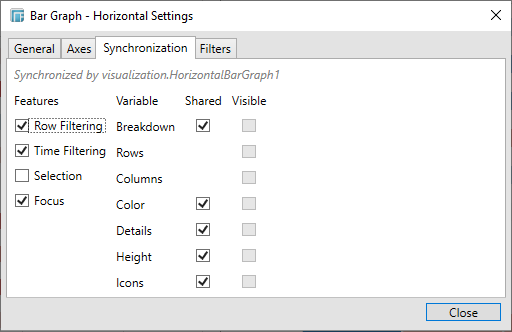
Note that the Visible check boxes for the follower or dependent visualization are all disabled.
-
Check the Shared boxes of the variables that will be shared by the leader visualization to its followers.
-
Click Close to save the changes and close the dialog.
Viewing the dashboard in Presentation Mode or the Web Client, only the leader visualization will have the enabled shelves.
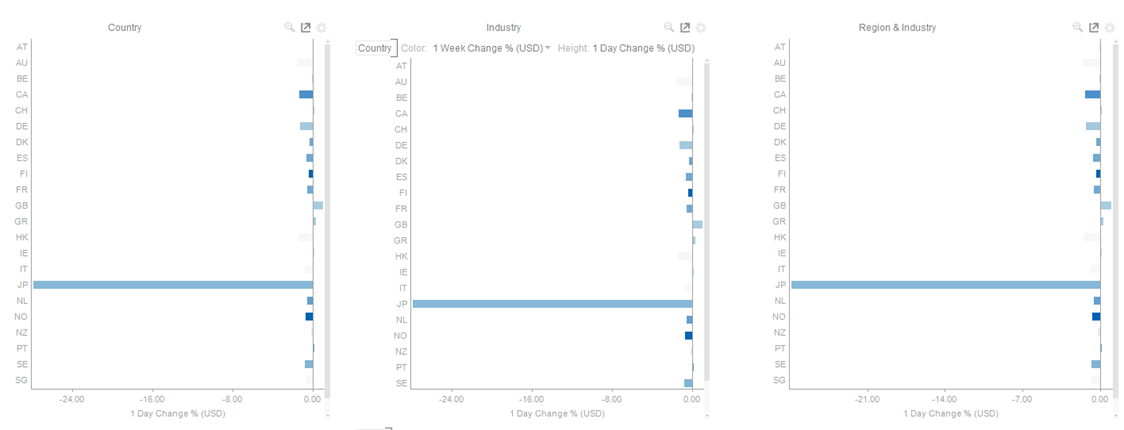
Also, when a new value is selected in a shared variable, the follower visualizations will be automatically updated.