


|
Stacked and Grouped Needle Graph
Stacked and Grouped Needle Graphs display time-based transactions or occurrence frequencies, similar to the standard Needle Graph.
It allows each transaction to be split into its components, allowing contributions to the total to be viewed across time.
Common uses include splitting of transaction volumes by venue or by direction (Buy/Sell).
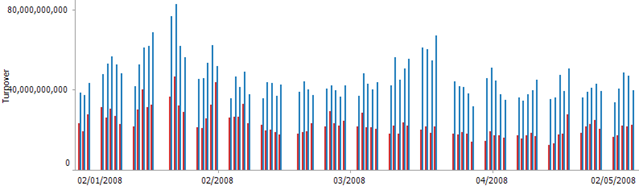
Figure 1. Samples of stacked and grouped needle graphs
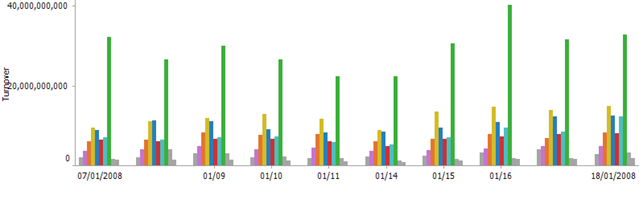
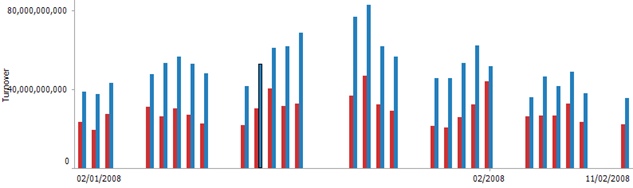
Figure 2. Stacked needle graph (Turnover by exchange)
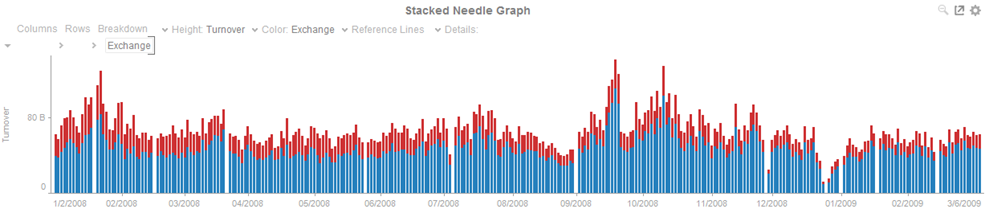
Figure 3. Stacked needle graph (Turnover by Exchange)
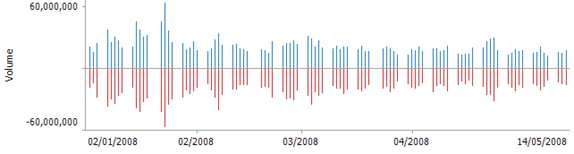
Figure 4. Stacked needle graph (Buy and sell volume - separated)
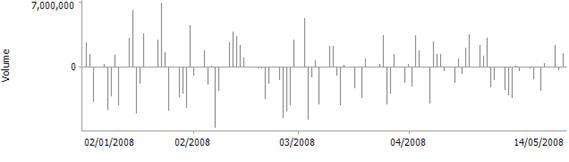
Figure 5. Stacked needle graph (Net volume through aggregation - Buy/Sell)