|
Sorting Visualizations
You can sort visualizations, and define the sorting method for each level of the breakdown.
Sorting Visualizations
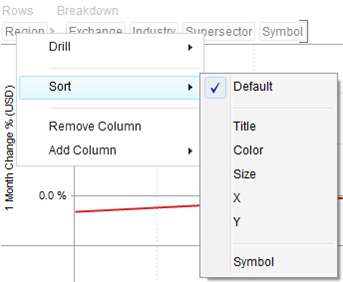
To enable sorting right-click on the breakdown item, select Sort from the context menu, and then select the appropriate Sort method.
Re-performing the operation, will sort the display in the opposite direction.
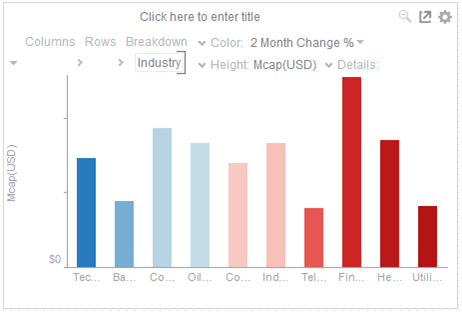
Sorting by Title (Ascending)
You can sort a visualization on any of the columns used in a breakdown, or as size, height, color or details.
This means that any of the columns in the data set is available to use as a basis for sorting, as long as the column is used for something in the visualization.
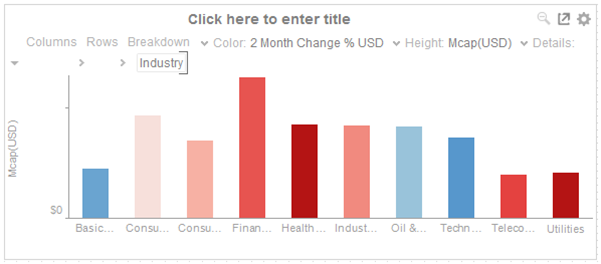
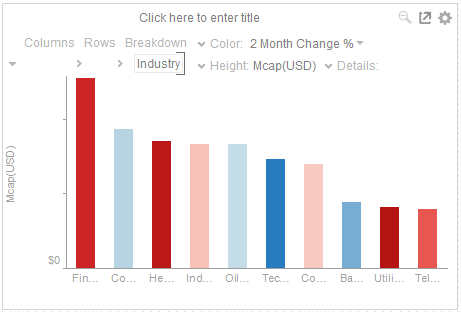
Sorting by Height (Descending)
Sorting is most useful in the following visualizations:
-
Bar Graphs
-
Treemaps (to produce a Heat Map)
-
Stack Graphs
-
Horizon Graphs
Right-click on a field and select Sort >Height in the context menu.
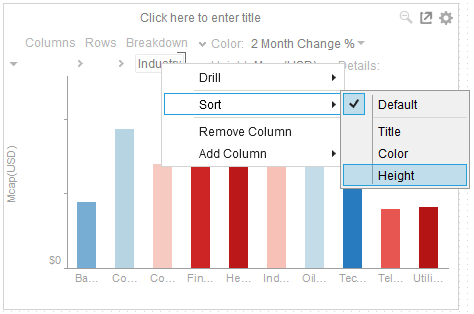
The graph is sorted by height.
Sorting by Color
The available sort methods correspond to the filled visualization variables, plus alphabetically on the breakdown title.
Right-click on a field and select Sort > Color in the context menu.
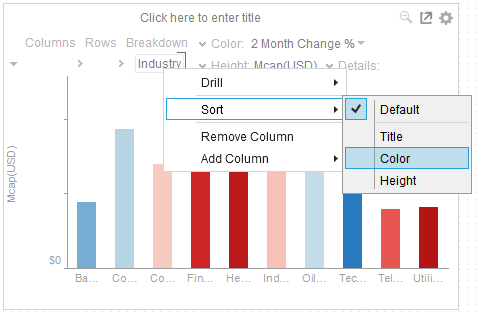
The graph is sorted by color.