


|
Record
A record visual is effectively a transposed table and can be used to display the metrics for one, or a few individual records (or aggregated records).
Like the table, metrics are added to “Visual Members”, but correspond to rows in the record (rather than columns in a table).
Row cells display their text value which may wrap into multiple lines.
Text can be colored either with a background or foreground.
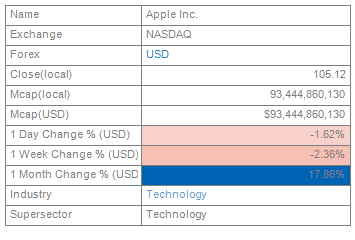
Figure 1. A Record showing a single set of aggregated metrics
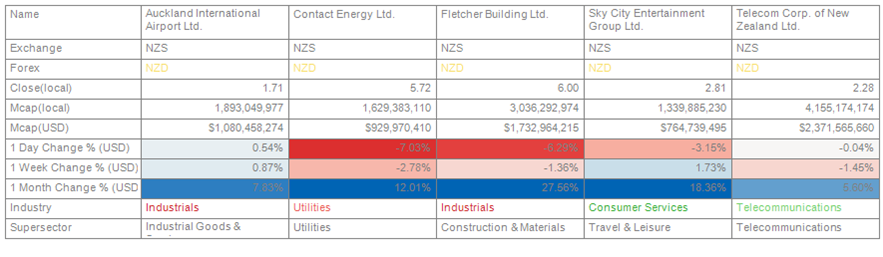
Figure 2. A Record visual showing multiple sets of aggregated metrics