|
Rank Filtering for the Table Visualization
For the Table visualization, the ranking will be taken from the node ordering within the hierarchy. The data set will be limited to display the top n based on the sorting of the data. When a column is clicked for sorting, the data set should be limited accordingly.
Rank Filtering for Tables
-
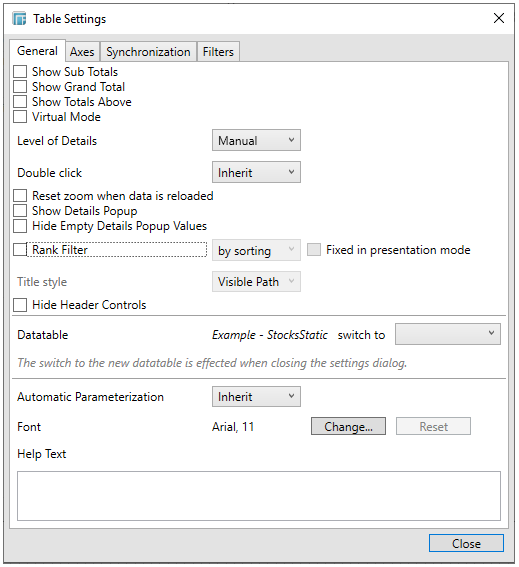
Click the Settings icon of a Table visualization.
The Table Settings dialog displays.
-
Check the Rank Filter box and click Close.

This displays the Number of Limit displayed drop-down list: All, 5, 10, 100, 1k, 10k.
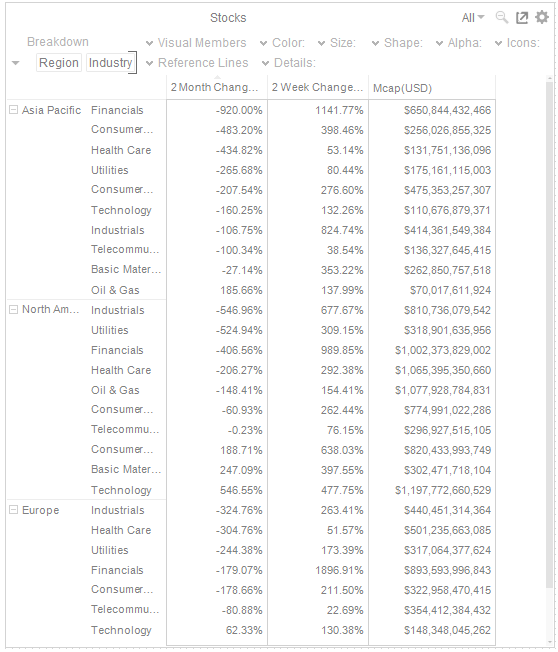
By default, Bottom 5 is selected with the bottom 5 values (e.g., -920.00%, -483.20%, -434.82%, -546.96%, -542.94%) of the leaf item (e.g., Industry field) for the next-to-leaf-node (e.g., Region field) in the breakdown.
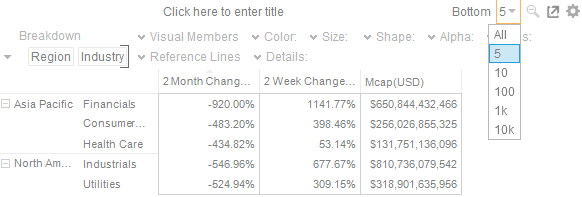
The data set will be limited to display the top/bottom n based on the sorting of the data. When a column is clicked for sorting, the data set be limited accordingly.
For the example above, the breakdown fields are based on the sorting made on the first Visual Member, 2 Month Change % USD.
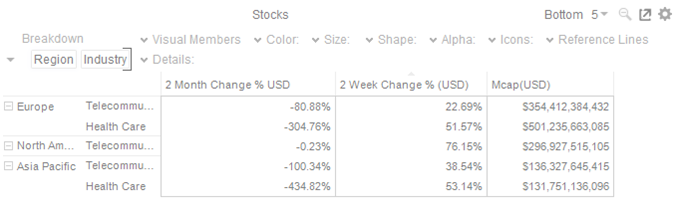
If the sorting is done on the second Visual Member, 2 Week Change % USD, then the Bottom 5 will be:
Examples:
-
-
All
-
-
-
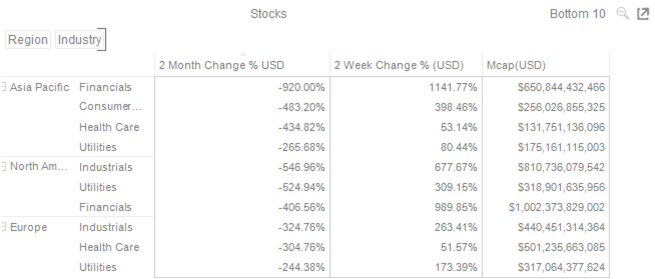
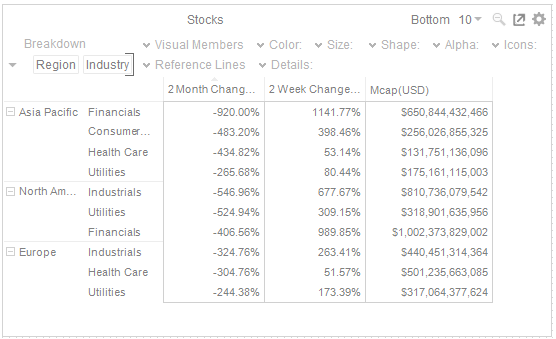
Bottom 10
-
Displays the bottom 10 values of the leaf item (e.g., Industry field) for the next-to-leaf-node (e.g., Region field) in the breakdown.
-
Check the Fixed in presentation mode box.
This disables the drop-down lists in the Presentation Mode. Only the labels of the options are displayed: