|
Pivoting
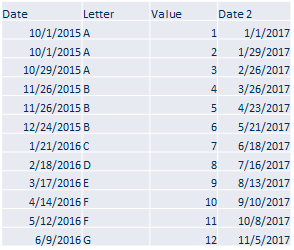
Pivoting in Panopticon Designer (Desktop) is always with respect to time. Panopticon Designer (Desktop) finds the first date or Date/Time column from left to right in the dataset and uses that. As an example, in the table below, if you want the Date 2 column to be the one used, transform the data so it will be the first date column in the dataset.
Pivoting in Panopticon Designer (Desktop) is about taking the row values in Category and turning them into columns by some operation like:
-
Count
-
Last
-
Min
-
Max
-
Sum (default)
Mean or median are not used since Panopticon Designer (Desktop) is about real time response, and these functions are expensive to calculate. For static data, if you need to pre-calculate those types of transformations, you can use a table visual to determine the value. However, for real-time data and real-time response, the functions Count, Last, Min, Max, and Sum are exactly what you need.
Multiple pivot columns can be defined.
Either different:
-
Measure Columns
-
Value Columns
-
Aggregates
When this occurs, the resulting pivoted column names will be prepended as appropriate to ensure that each column is uniquely identified.
NOTE: In cases where some columns cannot be aggregated after pivoting, it is recommended to select the None aggregate. This aggregate is only available in the Panopticon Visualization Server.
EXAMPLE 1
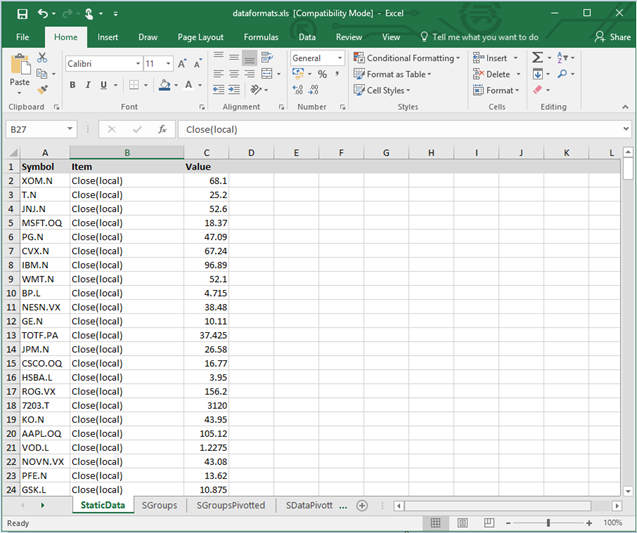
A common format for database sourced data is key value pairs. As an example below, price changes are listed as key value pairs for a set of symbols.
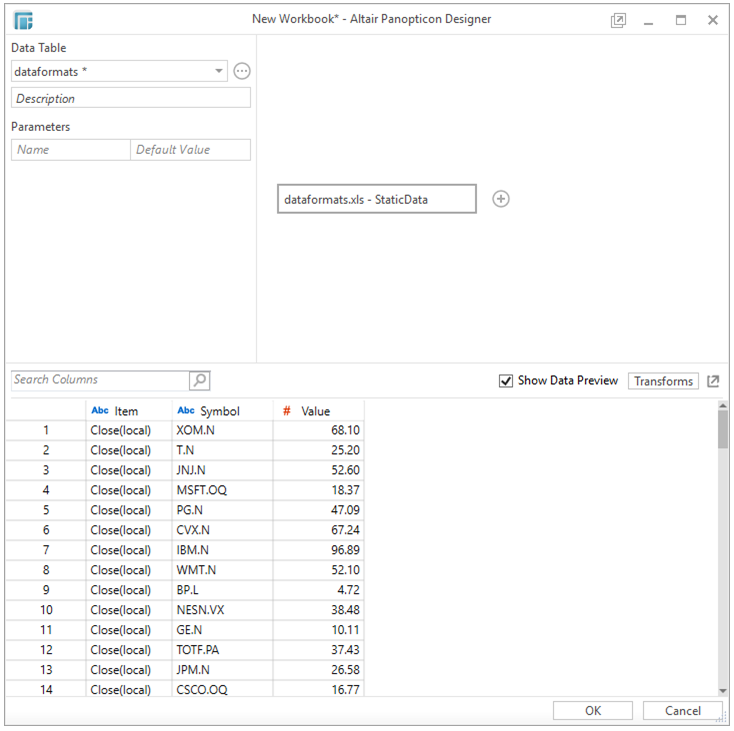
When retrieved the Data Table preview displays the same key value pair layout.
Pivoting Data
-
To pivot the data, click Transforms
 in the
Data Preview area.
in the
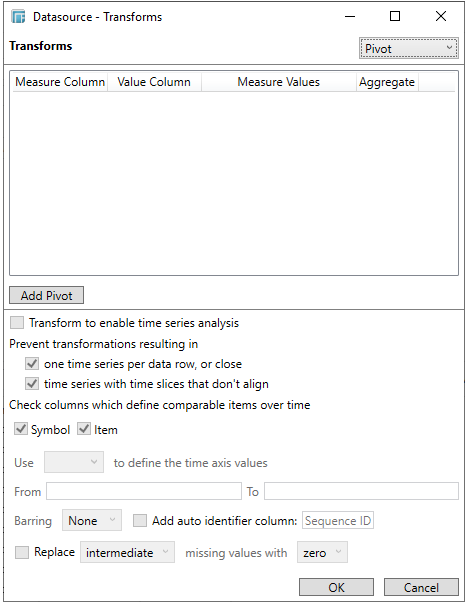
Data Preview area. The Datasource - Transforms dialog displays.
-
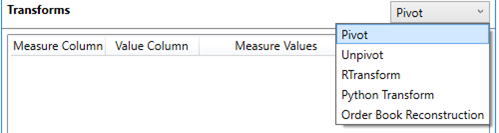
Select the Transforms to Pivot.
-
Click the Add Pivot button.
-
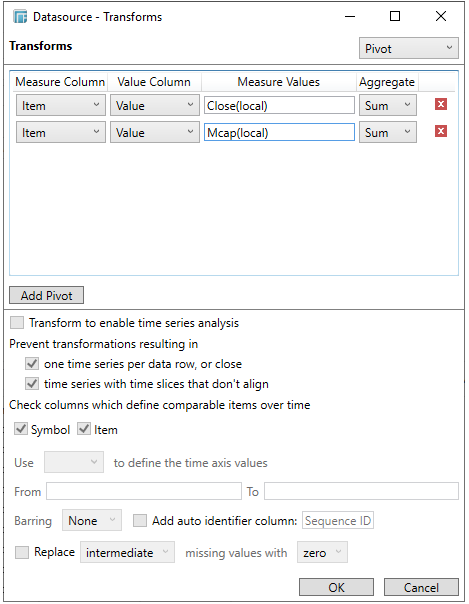
Select the Measure Column. This is the column that will be pivoted.
-
Select the Value Column.
-
Enter the possible Measure Values, which are listed in the Measure Column, and will become output columns of the pivot data transform.
-
Select the Aggregate method for the value column.
-
Click OK.
For example:
Measure Column = Item
Value Column = Value
Measure Values = Close(local), Mcap(local)
Aggregate = Sum
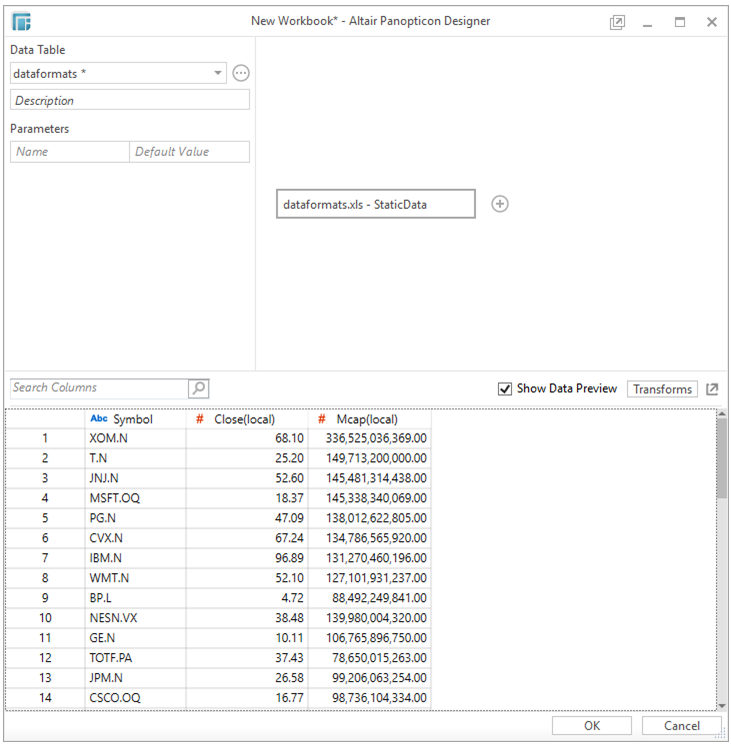
All columns that are not the Measure or Value columns will be removed from the output data structure.
The preview is updated to show the pivoted layout, which in the case below now shows each change as a separate data column. These pivoted results are additionally available as input into calculated columns.
EXAMPLE 2
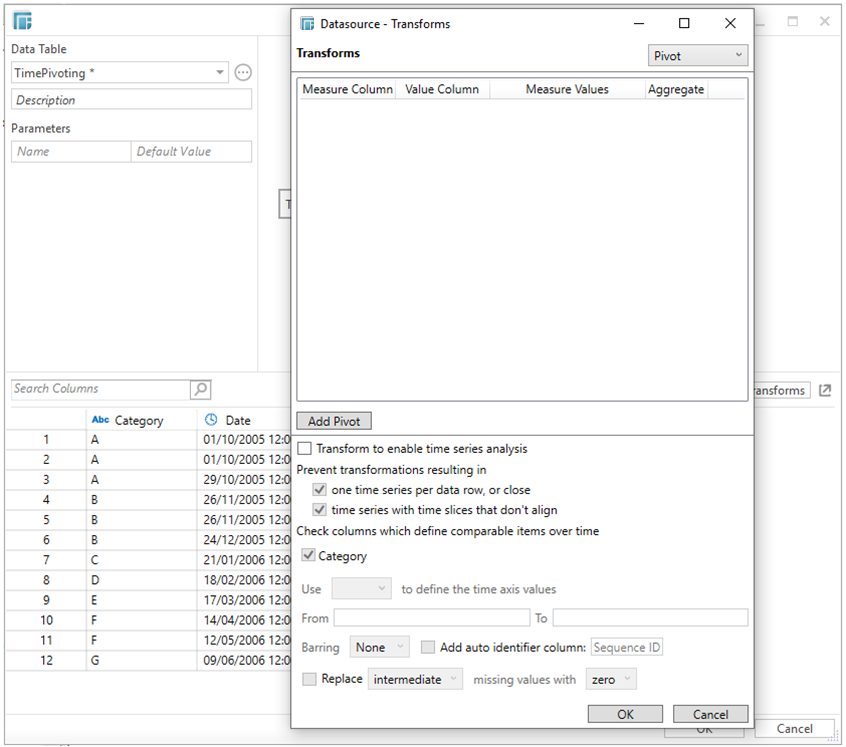
For the sample above, the Measure column is the one you want to pivot. In this case, you will need to pivot to create a unique Sum per date and measure.
The column named Letter will be used as the Measure (pivot) column, and value column (Value) is the one you will aggregate.
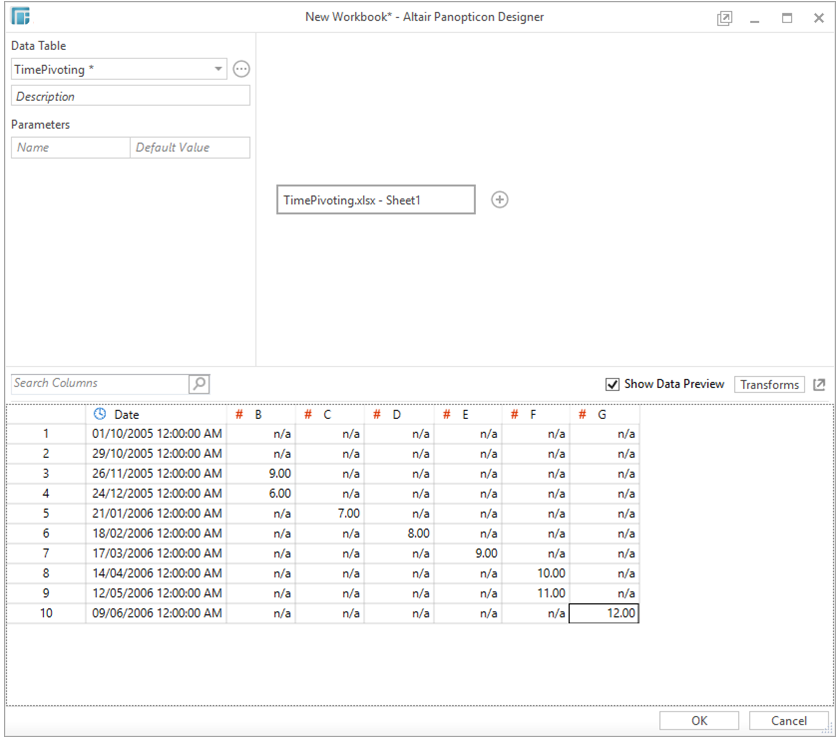
Enter the list of values that you want to aggregate (comma separated) into the Measure Values box (i.e., A, B, C, D, E, F, G). The default Sum aggregation is applied.
The Date column has been automatically chosen for the Category column as displayed at the bottom section of the dialog. Clicking OK transforms the data and is displayed in the Edit Data Table view.
The expected pivot is achieved as there is only one row per unique date, and the Letter and values columns are summed up.
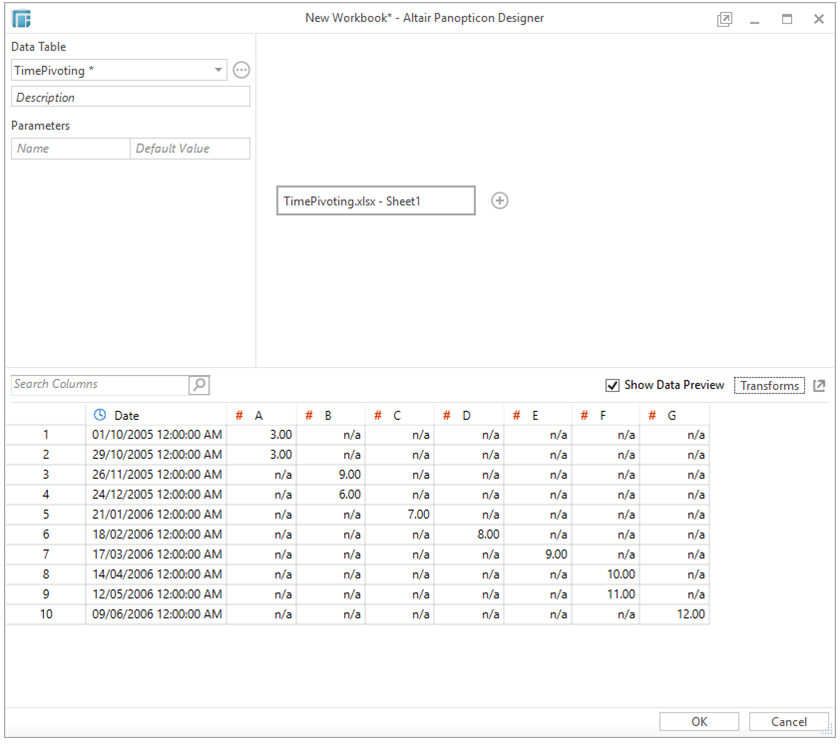
The original dataset had 12 rows, now it is reduced to 10 because the original dataset had the following rows:
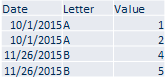
And they have been pivoted by Sum to the values in the first and third rows.
EXAMPLE 3
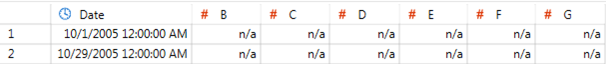
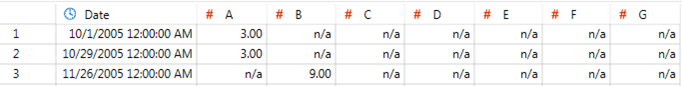
In the example above, you manually entered A, B, C, D, E, F, G into the Measure Values box. If you skip a value such as A, the transformed data will display as:
In the original dataset, the three rows with the A value had the dates 10/1/2015 12:00:00 AM and 10/29/2015 12:00:00 AM:
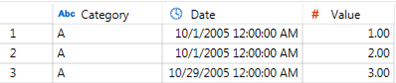
Not including the A value in the pivot still displayed the dates, but did not include the A data since in Designer, pivoting is always with respect to time.