


|
Percentage Area Graph
A Percentage Area Graph is like a Treemap spread out over time; you can see how each constituent part contributes to the total at any point in the time series. It is an excellent choice for visualizing time series data when you are interested in seeing the relative contributions for each data set in the series, regardless of the absolute total.
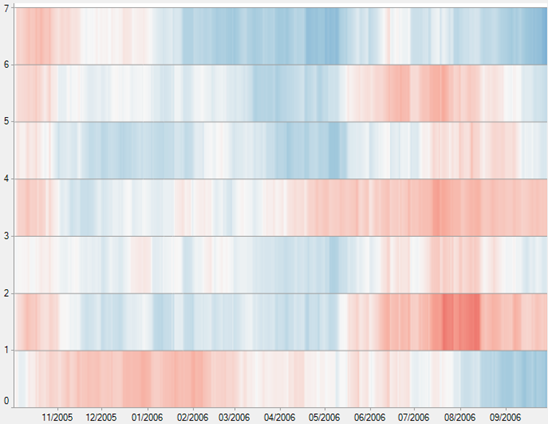
Figure 1. A percentage area graph