


|
Order Book Graph
The Order Book Graph displays an aggregated order book of prices and associated sizes across time. For each time slice, it displays:
-
Price (as Height)
-
Tick Size (as Size)
-
Order Size (as Color)
-
Duration of Aggregated Orders at a given price (time period)
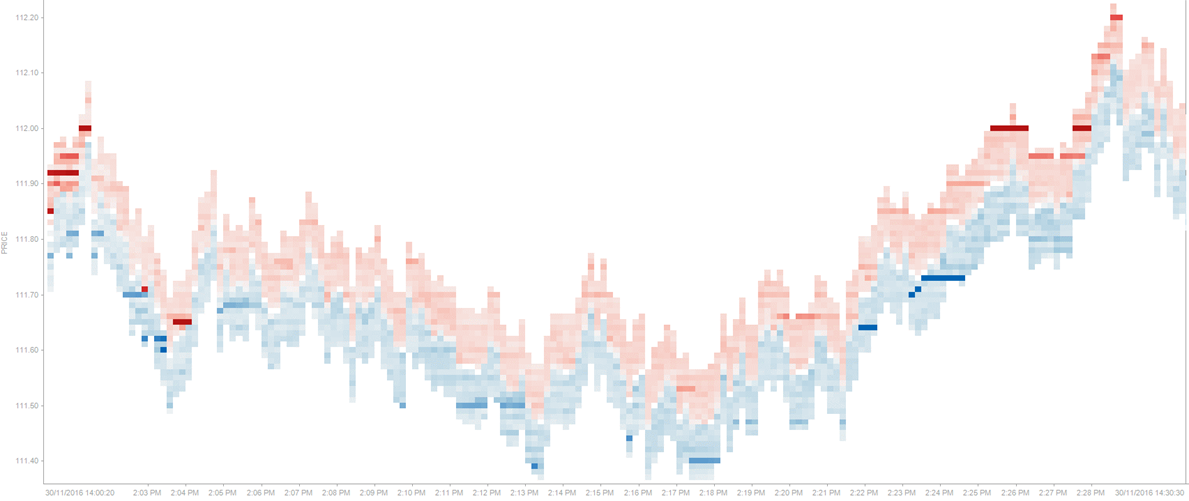
Figure 1. An order book graph displaying the top 10 levels of an orderbook across time.
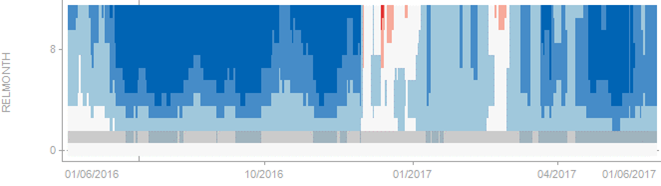
Figure 2. An order book graph displaying a forward curve across time.