


|
Numeric Needle Graph
Numeric Needle Graphs display price distributions.
Unlike a traditional Bar Graph, the X-Axis is numeric rather than categorical. Bars are positioned along the X-axis according to their X value, and their height is determined by their Y values. For the Horizontal variant, the X-axis represents the height, and the Y-axis the price.
This allows gaps, and clustering in price to be more accurately identified, and are typically used for displaying price distributions and order book displays.
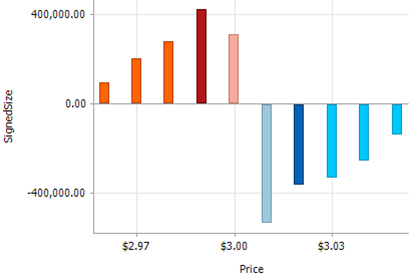
Figure 1. A numeric needle graph
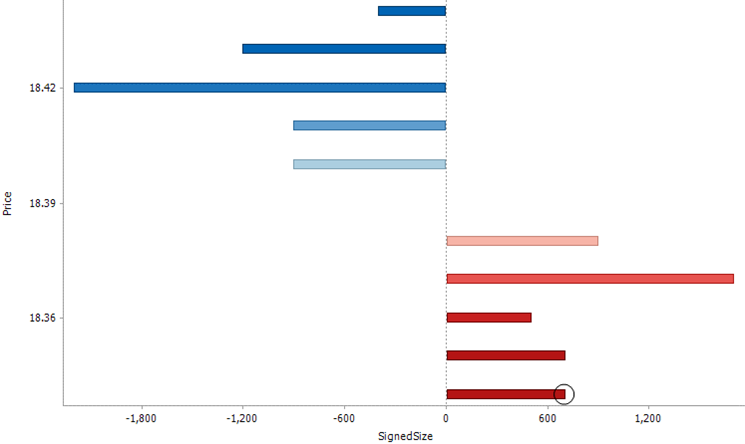
Figure 2. A horizontal numeric needle graph