


|
Numeric Axes
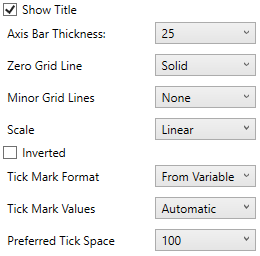
Visualizations supporting numeric axes include the following settings:
|
Setting |
Description |
|
Show Title |
Displays an Axis Title label. |
|
Axis Bar Thickness |
The margin in pixels for the axis. If set to zero, the axis is removed. |
|
Zero Grid Line
|
How a major X-axis grid line is drawn. Allowed values:
|
|
Minor Grid Line
|
How minor grid lines are drawn across the axis. Allowed values:
|
|
Scale
|
Determines whether the scale of the axis is Linear, Log 10, or Power.
NOTE: Does not support zero or negative values.
For example for values between -100 and 100, the axis will be: -100, -10, 0, 10, 100 |
|
Inverted |
Determines whether the Y or Height axis is inverted. |
|
Tick Mark Format |
Set to From Variable to use the format string that is on the current variable displayed in the axis. Set to Metric Prefix to format the Tick labels in the numeric axes using the metric prefixes. |
|
Tick Mark Values
|
Set to Automatic for automatic axis ranges or Manual to define specific tick marks. For Automatic: Tick marks (and if enabled Minor Grid Lines) are drawn approximately every n pixels, where n is defined by the Preferred Tick Space list box.
For Manual: The exact position of specific tick marks (and if enabled minor grid lines) can be specified. Additionally a custom label can be specified for each tick mark.
A common usage of Manual tick marks is when displaying yield curves, where the X-axis should display time span: |
|
Preferred Tick Space |
The preferred space in pixels between the minor grid lines across the axis. |