


|
Network Graph
A Network Graph displays relationships between entities, and can be used to identify correlations or flows between items.
The Network graph supports a two level breakdown defining the “From”, and “To”, where each node (vertex / point), is either in the “From”, or “To” levels of the breakdown, and each edge (or line), represents the data specific to this “From ? To” relationship.
The size of the node is specific to the number of interactions / relationships it has with other nodes. There can be up to two lines connecting two nodes, which can display arrows to show direction; and represent the “From ? To” combinations. E.g. A ? B, and B ? A. Each line can also be colored to map to a numeric variable.
Customers use network graphs for investigating correlations, transactional flows, latency, and throughput bottlenecks.
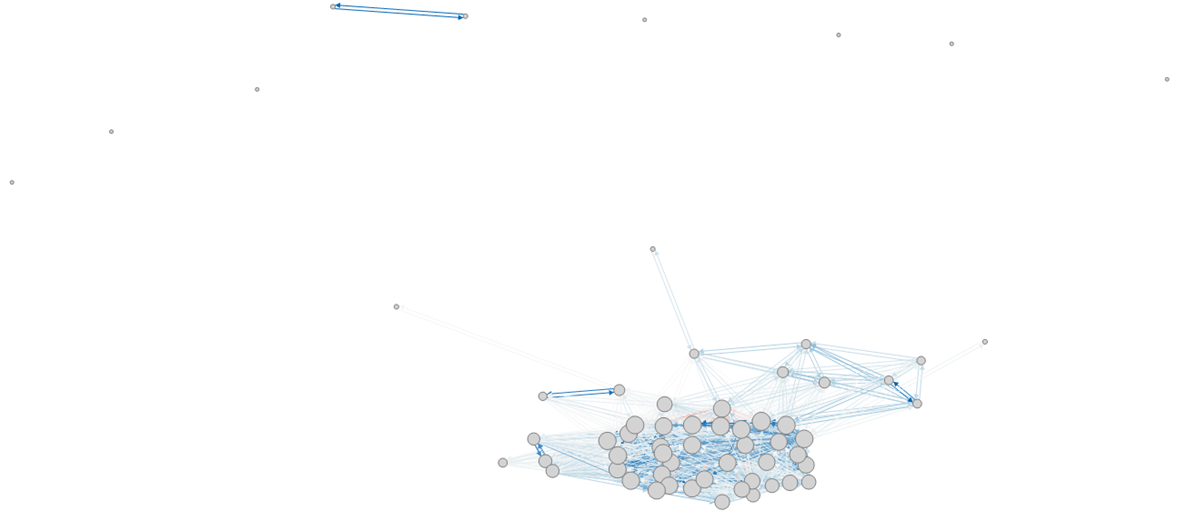
Figure 1. A Network Graph of Funds, and their constituent correlation