


|
Morphing Visualizations
Morphing Visualizations
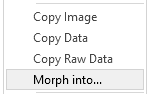
In Panopticon Designer, you can change a visualization into any other visualization by simply right-clicking and selecting Morph into, and then selecting the required resultant visualization from the available listing.
When used in combination with the copy and paste functionality, dashboards can be quickly created.
When morphing between visualizations with the same variables, there is no further configuration required. For example, from a Horizontal Bar Graph to a Vertical Bar Graph.
However when morphing between visualizations with different variables, the new visualization will need to be configured to include columns for empty variables. For example when converting from a Pie Chart to a Scatter Plot, the X and Y axes must be defined.