


|
Modify the Data Table that is Associated to the Visualization
The data table that was used to create a visualization can eventually be modified to other data tables that are available in the workbook.
Modifying Data Tables
-
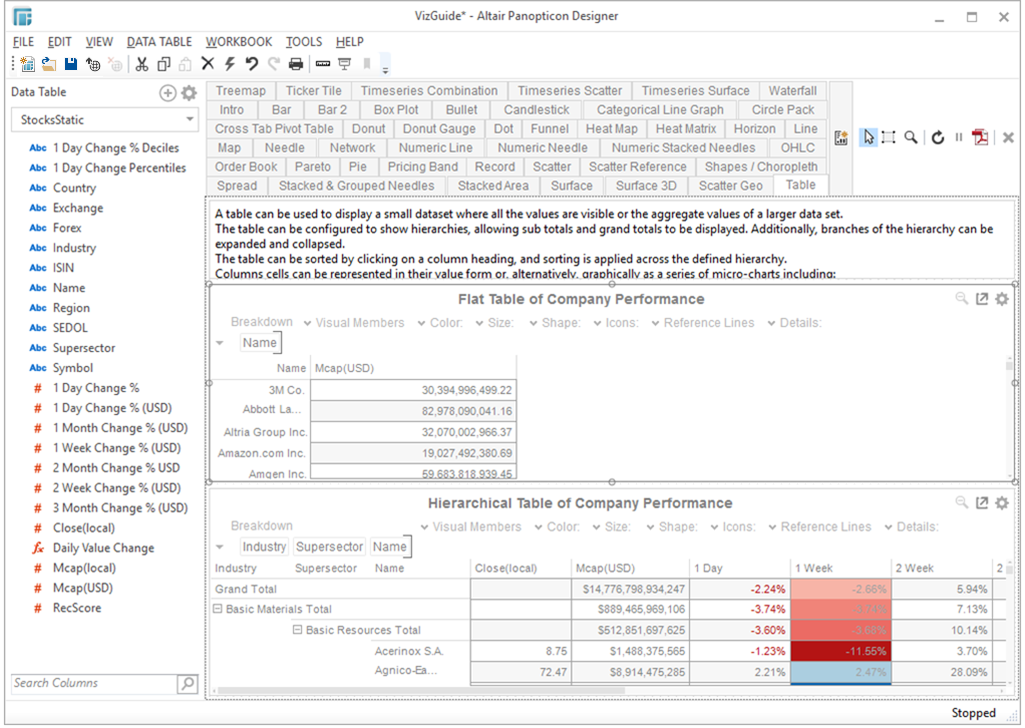
Click on a visualization.
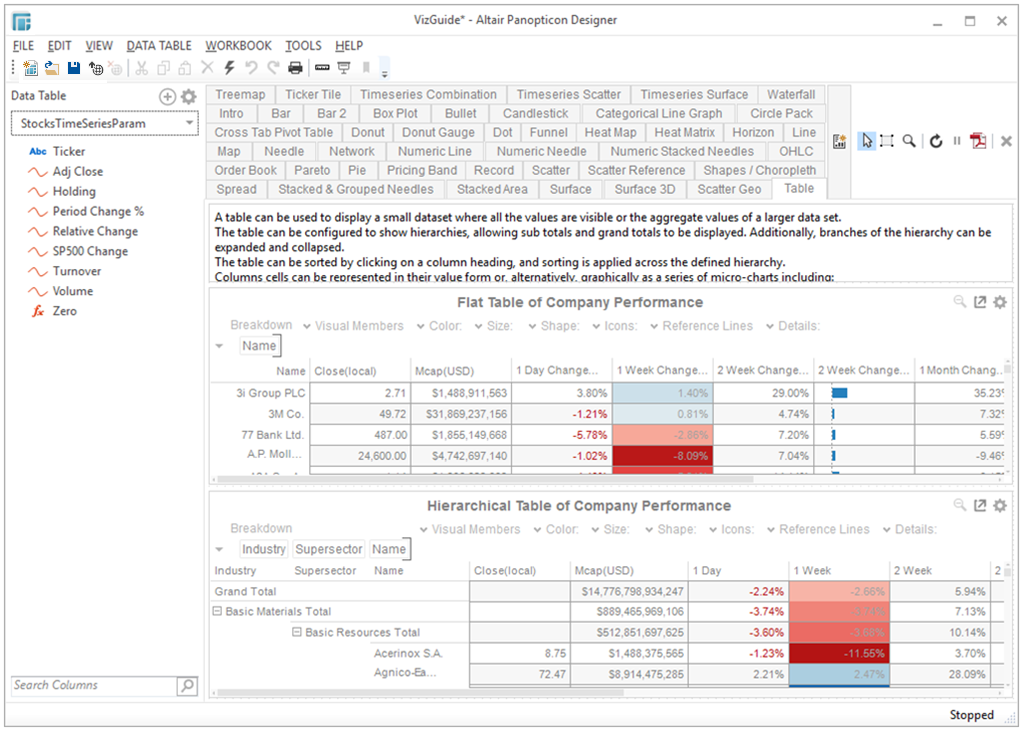
The associated data table is displayed on the Data Table pane.
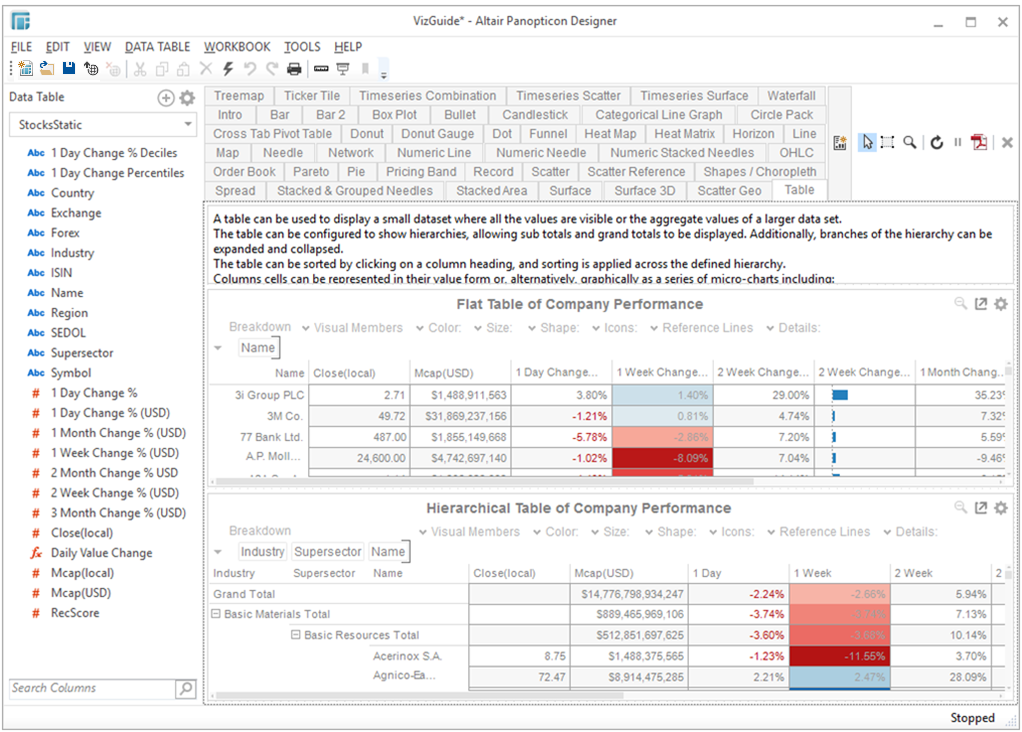
For this sample, the associated data table for the Flat Table of Company Performance visualization is StocksStatic.
-
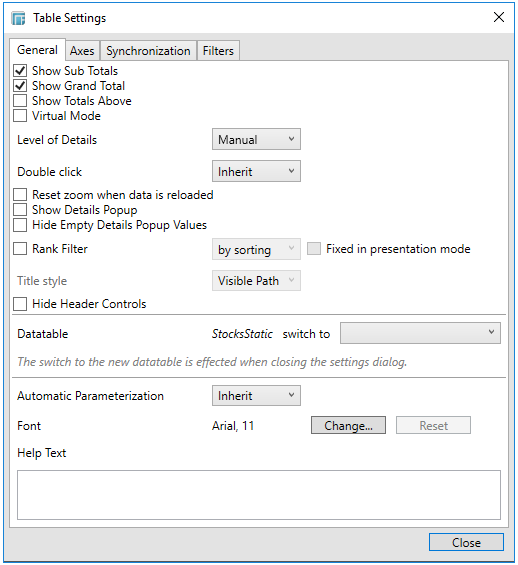
Click Settings
 . The Settings
dialog of the visualization displays.
. The Settings
dialog of the visualization displays.
-
Select another data table in the Datatable list.
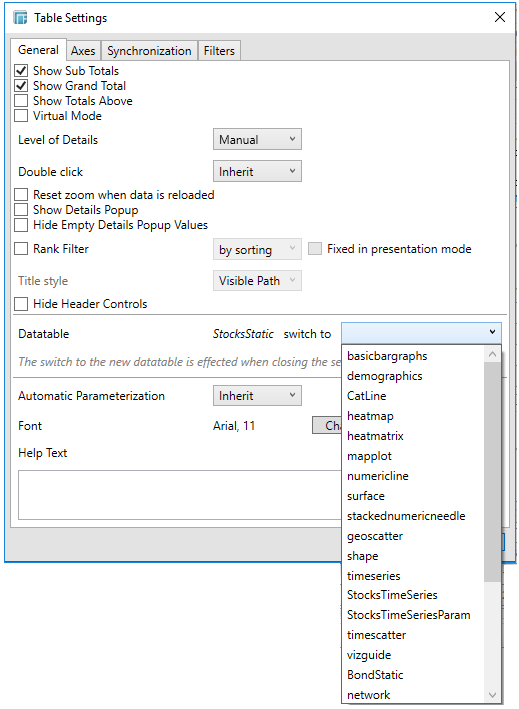
NOTE: The Datatable drop-down is filtered according to the visualization. For time series visualizations, only time series data tables are displayed. However, for non-time series visualizations, all data tables are displayed.
The switch to the new data table will be implemented when the Settings dialog is closed.
-
Click Close.
NOTES:
Any changes in the schema in the newly selected data table would cause variable with missing measures to be invalidated. In addition, breakdowns with missing dimensions will be invalidated.