


|
Level
Returns the level in the hierarchy for the node or numbered from the leaf.
Given this data table:
|
Industry |
Supersector |
Symbol |
3 Month Change % |
|
Financials |
Basic Resources |
ERST.VI |
-0.21 |
| Basic Materials | Basic Resources |
VOES.VI |
-0.35 |
|
Industrials |
Construction & Materials |
WBSV.VI |
-0.50 |
| Health Care | Health Care |
ICEL.VI |
0.06 |
| Industrials | Industrial Goods & Services |
ANDR.VI |
0.28 |
| Financials | Insurance |
VIGR.VI |
-0.10 |
| Oil & Gas | Oil & Gas |
OMVV.VI |
0.35 |
| Telecommunications | Telecommunications | TELA.VI |
0.11 |
| Utilities | Utilities | VERB.VI |
-0.12 |
| Financials | Real Estate | ATRV.VI |
-0.12 |
| Financials | Banks | BEN.AX |
-0.26 |
| Financials | Banks | SUN.AX |
-0.28 |
| Financials | Banks | NAB.AX |
-0.04 |
| Financials | Banks | ANZ.AX |
-0.11 |
| Financials | Banks | CBA.AX |
0.03 |
| Basic Materials | Basic Resources | BSL.AX |
0.15 |
Sample 1
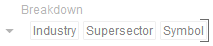
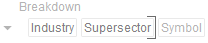
Below is the defined breakdown in a Table visualization:
The levels will be:
|
Column |
Level |
|
Symbol |
0 |
|
Supersector |
1 |
|
Symbol |
2 |
|
Root |
3 |
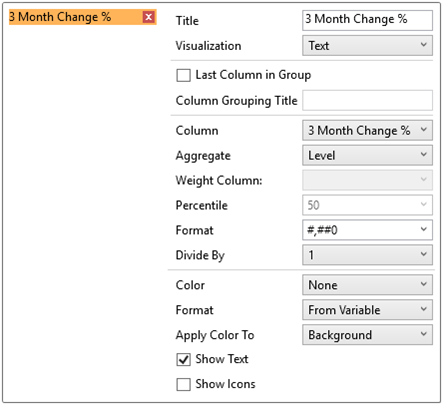
This table visualization is showing the grouping of the columns based on the breakdown hierarchy with 3 Month Change %'s aggregate set to Sum.
|
Industry |
Supersector |
Symbol |
3 Month Change % |
|
Basic Materials |
Basic Resources |
BSL.AX |
0.15 |
|
VOES.VI |
-0.35 |
||
|
Financials |
Banks |
ANZ.AX |
-0.11 |
|
BEN.AX |
-0.26 |
||
|
CBA.AX |
0.03 |
||
|
ERST.VI |
-0.21 |
||
|
NAB.AX |
-0.04 |
||
|
SUN.AX |
-0.28 |
||
|
|
Insurance |
VIGR.VI |
-0.10 |
|
|
Real Estate |
ATRV.VI |
-0.12 |
|
Health Care |
Health Care |
ICEL.VI |
0.06 |
|
Industrials |
Construction & Materials |
WBSV.VI |
-0.50 |
|
|
Industrial Goods & Services |
ANDR.VI |
0.28 |
|
Oil & Gas |
Oil & Gas |
OMVV.VI |
0.35 |
|
Telecommunications |
Telecommunications |
TELA.VI |
0.11 |
|
Utilities |
Utilities |
VERB.VI |
-0.12 |
Changing the aggregate to Level and the format to #,##0 will produce this table since the Visible Depth is set until Symbol:
|
Industry |
Supersector |
Symbol |
3 Month Change % |
|
Basic Materials |
Basic Resources |
BSL.AX |
0 |
|
VOES.VI |
0 |
||
|
Financials |
Banks |
ANZ.AX |
0 |
|
BEN.AX |
0 |
||
|
CBA.AX |
0 |
||
|
ERST.VI |
0 |
||
|
NAB.AX |
0 |
||
|
SUN.AX |
0 |
||
|
|
Insurance |
VIGR.VI |
0 |
|
|
Real Estate |
ATRV.VI |
0 |
|
Health Care |
Health Care |
ICEL.VI |
0 |
|
Industrials |
Construction & Materials |
WBSV.VI |
0 |
|
|
Industrial Goods & Services |
ANDR.VI |
0 |
|
Oil & Gas |
Oil & Gas |
OMVV.VI |
0 |
|
Telecommunications |
Telecommunications |
TELA.VI |
0 |
|
Utilities |
Utilities |
VERB.VI |
0 |
Sample 2
Clicking on Supersector will make the Symbol breakdown column invisible:
The results will be:
|
Industry |
Supersector |
3 Month Change % |
|
Basic Materials |
Basic Resources |
1 |
|
Financials |
Banks |
1 |
|
|
Insurance |
1 |
|
Real Estate |
1 |
|
|
Health Care |
Health Care |
1 |
|
Industrials |
Construction & Materials |
1 |
|
|
Industrial Goods & Services |
1 |
|
Oil & Gas |
Oil & Gas |
1 |
|
Telecommunications |
Telecommunications |
1 |
|
Utilities |
Utilities |
1 |
Sample 3
Collapsing columns in the table can also change the Level values:
|
Industry |
Supersector |
3 Month Change % |
|
Basic Materials |
Basic Resources |
1 |
|
Financials |
Banks |
1 |
|
|
Insurance |
1 |
|
Real Estate |
1 |
|
|
Health Care |
|
2 |
|
Industrials |
Construction & Materials |
1 |
|
|
Industrial Goods & Services |
1 |
|
Oil & Gas |
|
2 |
|
Telecommunications |
Telecommunications |
1 |
|
Utilities |
Utilities |
1 |
Sample 4
Clicking to the Root in the breakdown hierarchy:

will produce:
|
3 Month Change % |
|
3 |
The Level aggregate can also be used when creating Calculated columns.
-
Bring up the Calculated Column dialog:
-
-
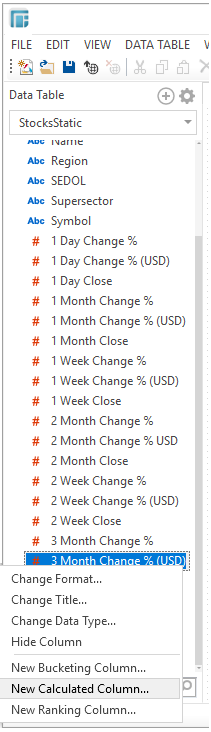
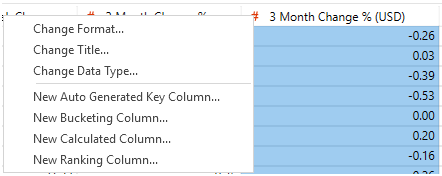
in the Workbook in Design Mode layout, right-click on a numeric column in the Data Table list and select New Calculated Column
-
-
-
in the Edit Data Table layout, right-click on a numeric column and select New Calculated Column
-
Build the Expression with the Level aggregate.
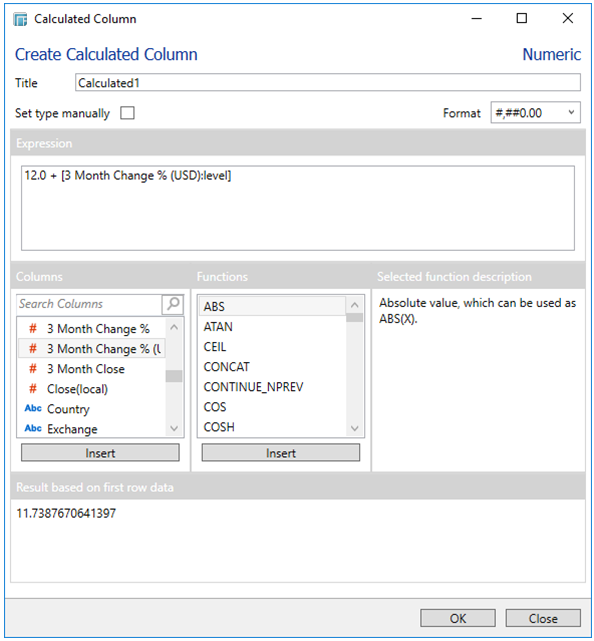
For example: 12.0 + [3 Month Change % (USD):level]
When all of the Levels are visible in the breakdown (Sample 1), the results will be:
|
Industry |
Supersector |
Symbol |
3 Month Change % |
Calculated 1 |
|
Basic Materials |
Basic Resources |
BSL.AX |
0 |
12.0 |
|
VOES.VI |
0 |
12.0 |
||
|
Financials |
Banks |
ANZ.AX |
0 |
12.0 |
|
BEN.AX |
0 |
12.0 |
||
|
CBA.AX |
0 |
12.0 |
||
|
ERST.VI |
0 |
12.0 |
||
|
NAB.AX |
0 |
12.0 |
||
|
SUN.AX |
0 |
12.0 |
||
|
|
Insurance |
VIGR.VI |
0 |
12.0 |
|
|
Real Estate |
ATRV.VI |
0 |
12.0 |
|
Health Care |
Health Care |
ICEL.VI |
0 |
12.0 |
|
Industrials |
Construction & Materials |
WBSV.VI |
0 |
12.0 |
|
|
Industrial Goods & Services |
ANDR.VI |
0 |
12.0 |
|
Oil & Gas |
Oil & Gas |
OMVV.VI |
0 |
12.0 |
|
Telecommunications |
Telecommunications |
TELA.VI |
0 |
12.0 |
|
Utilities |
Utilities |
VERB.VI |
0 |
12.0 |
Moving the Visible Depth until Supersector (based on Sample 3) will result to:
|
Industry |
Supersector |
3 Month Change % |
Calculated 1 |
|
Basic Materials |
Basic Resources |
1 |
13.0 |
|
Financials |
Banks |
1 |
13.0 |
|
|
Insurance |
1 |
13.0 |
|
Real Estate |
1 |
13.0 |
|
|
Health Care |
|
2 |
14.0 |
|
Industrials |
Construction & Materials |
1 |
13.0 |
|
|
Industrial Goods & Services |
1 |
13.0 |
|
Oil & Gas |
|
2 |
14.0 |
|
Telecommunications |
Telecommunications |
1 |
13.0 |
|
Utilities |
Utilities |
1 |
13.0 |