


|
JMX
The JMX connector is used to access the Java Server Monitoring counters.
NOTE: The JMX connector only supports String and Numeric attributes. Extracting values from attributes with type “array”/”collection” or from “composite” attribute is not yet supported.
Using JMX
-
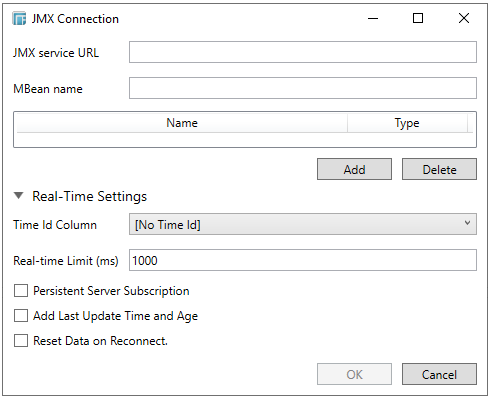
When creating a new data table, select JMX from the Connect to data dialog. The JMX Connection dialog is displayed.
-
Enter the JMX service URL and the MBean name.
-
Click Add. The counters are displayed in the list.
You can also select a counter and click Delete to remove it in the list.
-
You can modify the data type of the counter fields.
-
Expand Real-Time Settings.
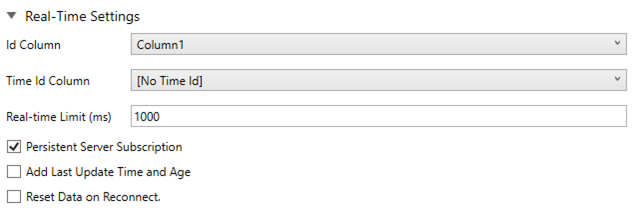
Refer to Defining Real-Time Settings for more information.
-
Click OK to confirm the selection and retrieve the record set into Panopticon Designer (Desktop).
Initially, there is no data displayed in the Data Source Preview section of the Edit Data Table window.
Click the Start Preview button to display the data and refresh the values depending on the defined Refresh Period.
IMPORTANT:
Using the Java Mission Control (JMC) only produce attributes added by JMC itself (e.g., FreeHeapMemory, FreeNonHeapMemory, HeapMemoryUsagePercent in java.lang:type=Memory) that will not be accessed by the JMX connector since they are not produced by JMX.
Instead of using JMC, use JConsole, available in JDK/bin. It also gives access to JMX but only displays the real JMX attributes.