


|
Heat Matrix
A Heat Matrix is similar to both the Heat Map and Treemap in that it displays many different data items and represents the value for each item using colors. However, unlike its cousins, the Heat Matrix has a defined structure where two data attributes define each axis, thus producing a correlation matrix. Within the Heat Matrix, each column and row represents a unique attribute, and the point where two items intersect represents a unique combination of the two attributes.
The matrix can display labels within each intersecting tile or simply display color.
Our Heat Matrix data visualization helps our clients identify correlations within their data sets using an intuitive graphical display.
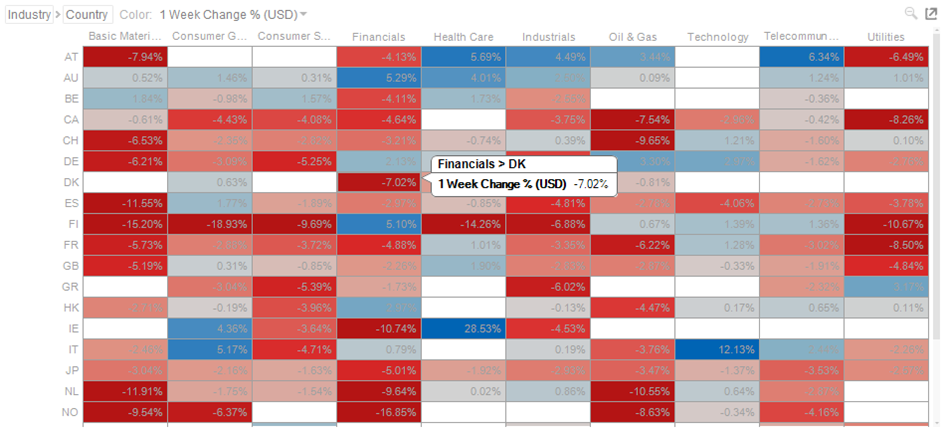
Figure 1. A heat matrix
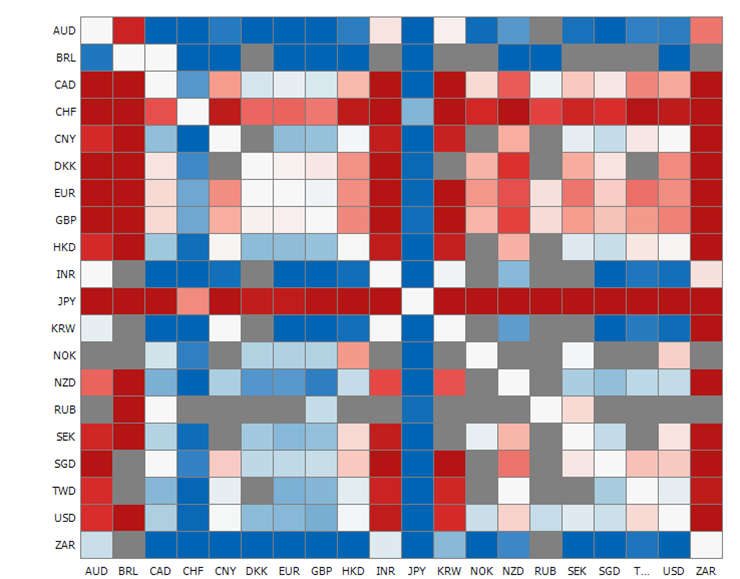
Figure 2. An FX cross rates heat matrix