


|
Grouping Columns in Table Visualizations
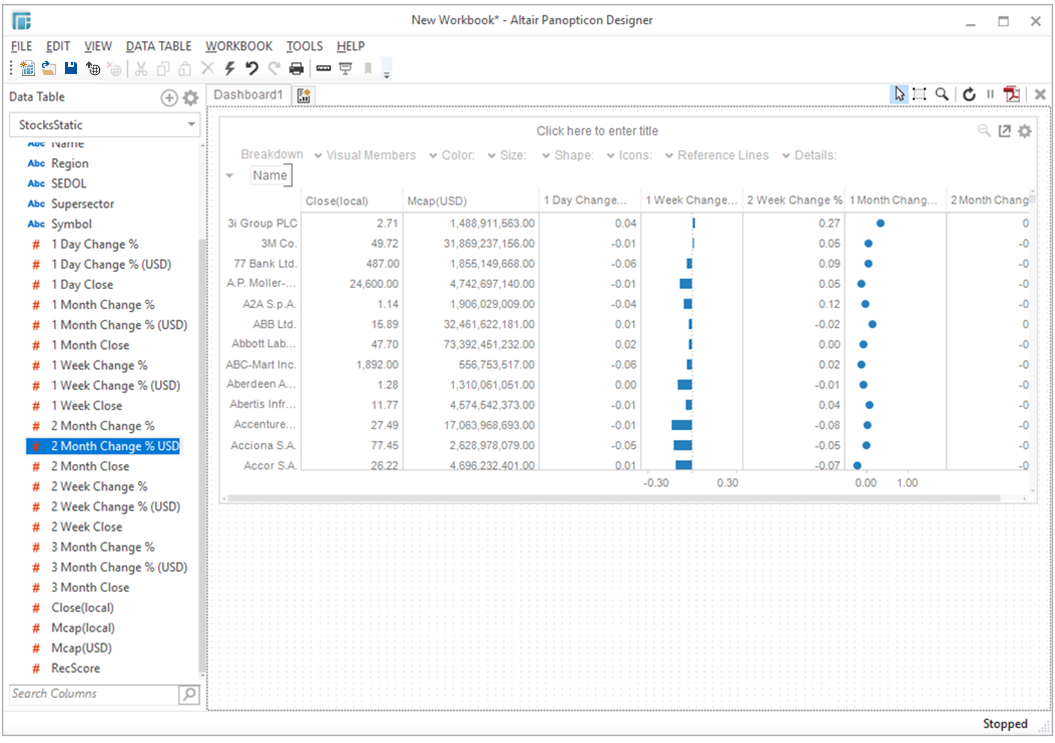
Visual members of a Table visualization can be grouped into sections.
Grouping Columns in Table Visualizations
-
Open or create a Table visualization and add columns in the Visual Members variable.
-
Expand the Visual Members drop down to display the list of columns/visual members that were added.
The sample Table above has the following columns:
NOTE: The inclusion of columns in a group will be based on their sequence in the Visual Members list.
For example, the following groups will be created:
First group: Close(local) and Mcap(USD)
Second group: 1 Day Change % (USD), 1 Week Change % (USD), and 2 Week Change
Third group: 1 Month Change % (USD), 2 Month Change % (USD), and 3 Month Change % (USD)
Forex and Symbol will not be included in any group.
-
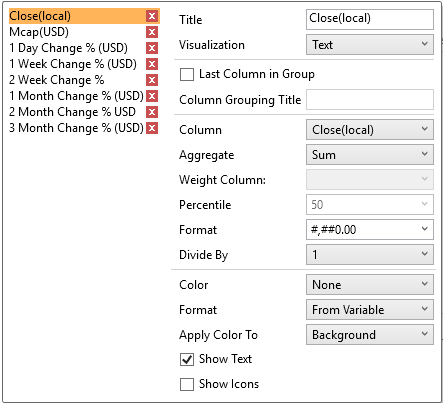
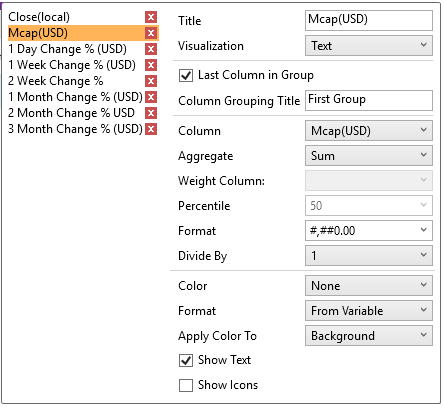
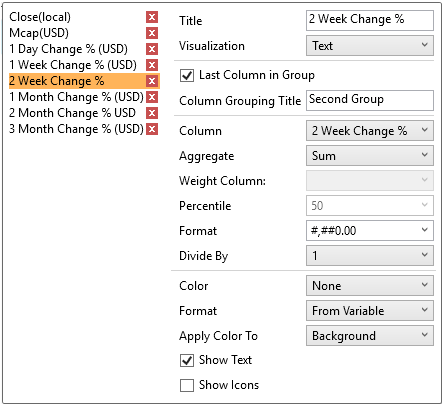
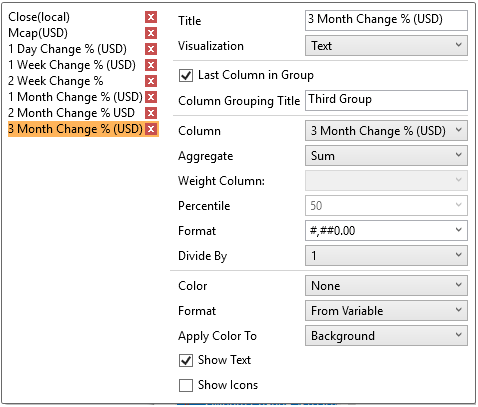
For the groupings, click the following columns, check the Last Column in Group box, and enter the Column Grouping Title:
-
-
First group: Mcap(USD)
-
-
-
Second group: 2 Week Change % (USD)
-
-
-
Third group: 3 Month Change % (USD)
-
-
Save the changes in the workbook either by:
-
-
selecting File > Save from the menu bar
-
or clicking
 on the toolbar.
-
NOTE: The groupings will only be displayed when you view the workbook on the Web Client.
-
Publish the workbook on the Panopticon Visualization Server either by:
-
-
File > Publish on the menu bar
-
or clicking
 on the toolbar.
-
Note that these options are only enabled when Panopticon Designer (Desktop) is connected to a Panopticon Visualization Server.