


|
Geographic Scatter Plot
Use Geographic Scatter Plots to display data where physical location is important, and the background map image can be manually provided. These plots clearly show data correlations and clustering that is geographic in nature, and typically used for non-standard mapping.
If a standard map is required then it is likely that the Map Plot should be used instead.
In Geographic Scatter Plots, the X and Y coordinates can correspond to longitude and latitude. The color and size of each scatter point represent other data variables.
As with standard statistical Scatter Plots, you can zoom and pan within the visualization to focus on specific areas of interest, but the underlying map image will not change.
As the background map image is manually provided, the visualization can be used for non-traditional maps, such as internal floor plans.
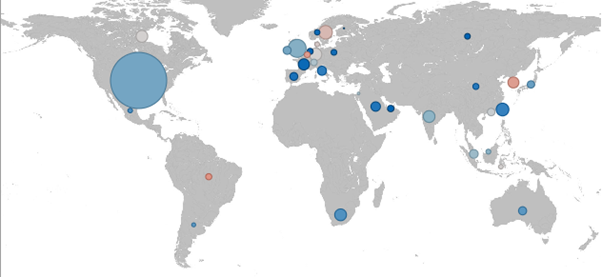
Figure 1. A geographic scatter plot