


|
Funnel Chart
Funnel Charts are a type of Bar Graph, often used to represent stages in a sales process or order fulfillment process, and can show the amount of potential revenue for each stage.
This type of chart can be useful in identifying potential problems in an organization's sales process.
Color can be used to represent either a Stage in the process, or the change in performance for that stage against a prior period.
Alternatives to the Funnel Chart would be a simple Bar Graph, or a Stacked Bar Graph.
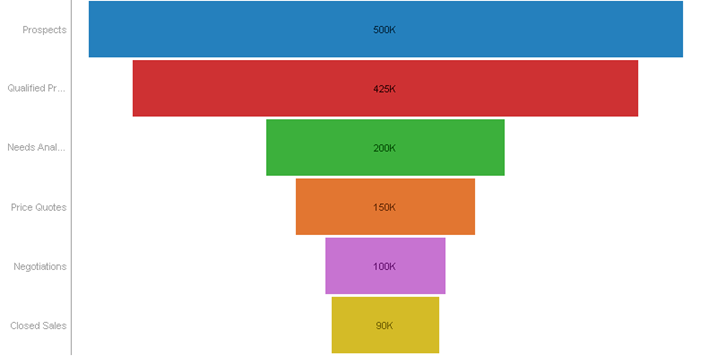
Figure 1. Funnel Chart with color showing Stage in the Funnel
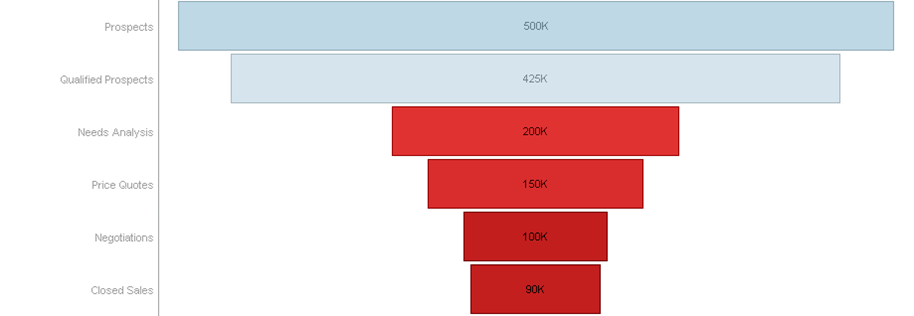
Figure 2. Funnel Chart with color showing Change in Performance