|
Diverging Color Palettes
Diverging Palettes use a three color gradient between a minimum, middle and a maximum value. Numeric columns containing both positive and negative values default to the Diverging Palette with the Red White Blue color palette selected.
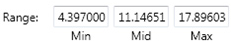
Diverging Palettes use the Range Midpoint. The Min, Mean, and Max points are populated with defaults from the data set.
-
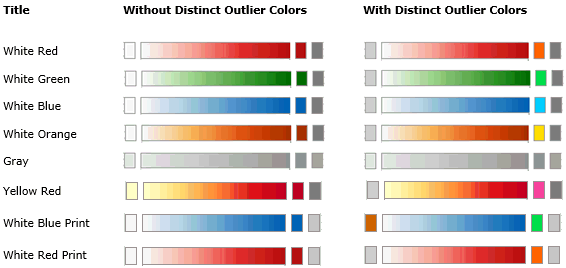
Sequential color palettes:
-
Diverging color palettes:
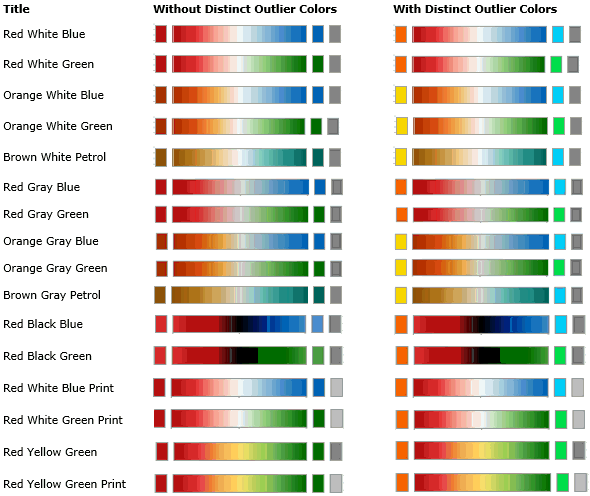
Diverging Color Palettes
-
The color palette can either be a continuous color gradient or a stepped color gradient.

You can define this setting using the appropriate radio button:
-
-
Continuous Colors produces this effect:
-

-
-
Stepped Colors produces this effect:
-

-
Select the number of steps in the gradient in the Stepped colors list box. The default is 5 colors.
-
You can reverse the color palette for cases where a high number indicates poor performance. For example, if your data shows high risk as a high number, it may be more useful to display high risk using Red rather than Blue.
-
Standard Palette
-

-
-
Reversed Palette
-

-
When outliers are of particular interest, you can highlight outliers using the Distinct Outlier Colors function.
-
Without Outlier Colors
-

-
-
With Outlier Colors
-

Where only the outliers are important, the central color range is grayed and only the Distinct Outlier Colors are used in the Visualization.
 becomes

-
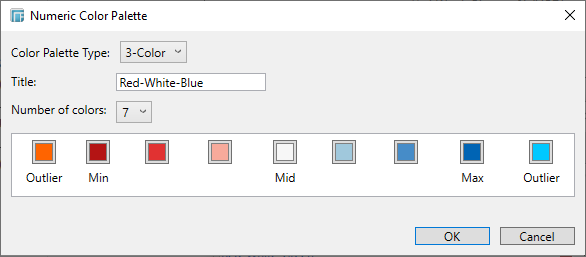
You can also edit the selected color palette by clicking the Edit Color Palettes button.
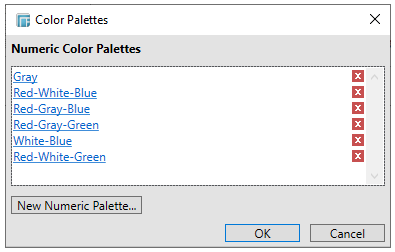
Then clicking a numeric color palette. This displays the color palette settings and lets you modify existing color palettes or create new ones: