


|
Dashboard Design
You can begin designing your Panopticon Designer (Desktop) Dashboard only after data is available to the Workbook.
IMPORTANT: You must be in Design Mode to create a new Dashboard or alter an existing Dashboard.
Panopticon Designer (Desktop) presents a blank canvas similar to a blank PowerPoint slide.
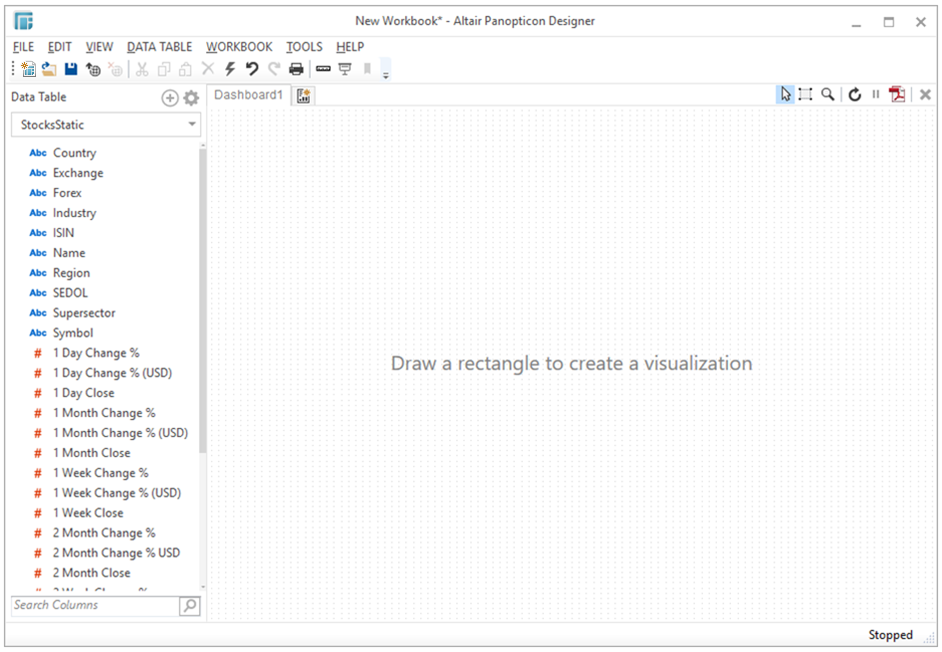
Draw a rectangle in the dashboard canvas to add parts of the Dashboard. A Parts dialog displays.
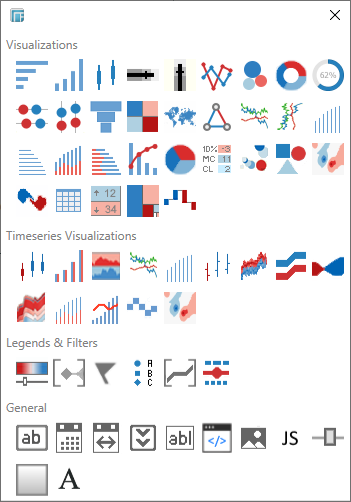
You can select several types of item that you can add to the dashboard:
-
Visualizations. Panopticon Designer (Desktop) supports a wide range of data visualizations for static and Time Series data. You must populate Visualizations with data columns in order for them to function.
-
Relative Layout Panel. Allows resizing of the visualizations in a dashboard.
-
Legends: You can link Legends to Visualization using drag and drop commands. Three types of legend are supported: Color, Icons & Reference Lines.
-
Filters: Panopticon Designer (Desktop) lets you filter your data in order to highlight outliers, patterns and trends. You must populate Filters with data columns in order for them to function.
-
Text Boxes: These can be completely independent of your data. Add labels and explanatory text to help users better understands how to use a Dashboard using Text Boxes. Or link them up to a data column for dynamic displays.
-
Image Boxes: These are also independent of your data. Add logos or other graphics to your dashboards using Image Boxes.
-
Action Controls: These allow actions to be executed against pre-defined selections, and can be used to provide inputs to filtered data sets.
Once you have items from the Parts dialog box on the blank canvas, you can move them around, resize them and remove them.
After you have added Visualizations to your Dashboard, you can drag data columns from the selected data table and drop them on the Visualizations to build up your display.
Each blank canvas represents a single Dashboard. You can add as many Dashboards as you like to a Workbook. These appear as tabs at the top of the screen. Switch between Dashboards by clicking on the appropriate tab.
The Design mode shows Data Table panel on the left:
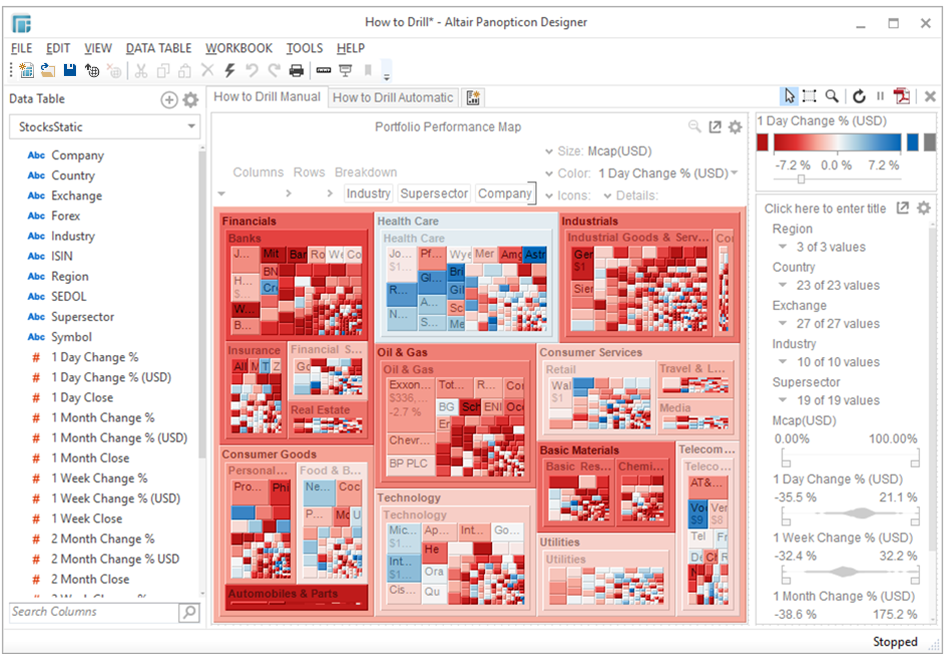
The Data Table Panel provides access to the data schema to populate the dashboards.
NOTE: Right-clicking on a field in the Data Table panel displays Context Menu operations that are also available in the Data Preview area in the Edit Data Table view except for Hide Columns. Refer to Data Source Preview Operations for more information.