


|
Cross Tab Pivot Table
Although selected visualizations can be cross-tabbed into small multiples, each showing subsets of the original data set, the Cross Tab can itself be used to display a Pivot table.
Pivot Tables support a single numeric value being represented at the cross point of hierarchical rows and columns.
Each intersection cell can display the aggregated numeric value and its associated color range, which can be subdued or intense.
Numeric labels can also be removed to produce a Heat Matrix.
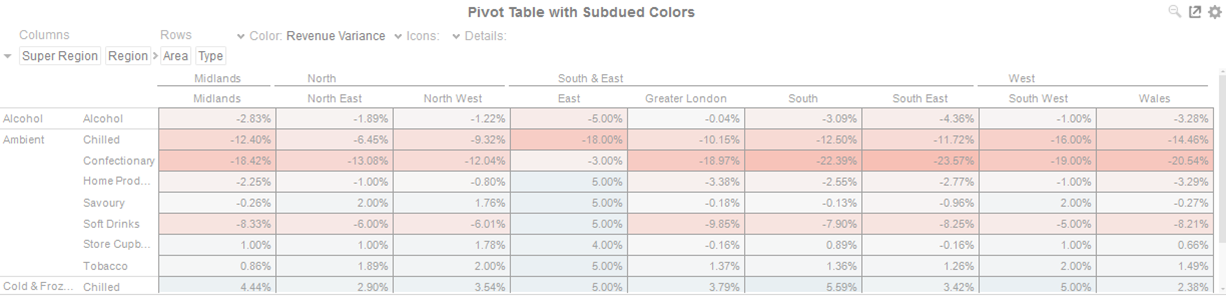
Figure 1. A pivot table with subdued colors
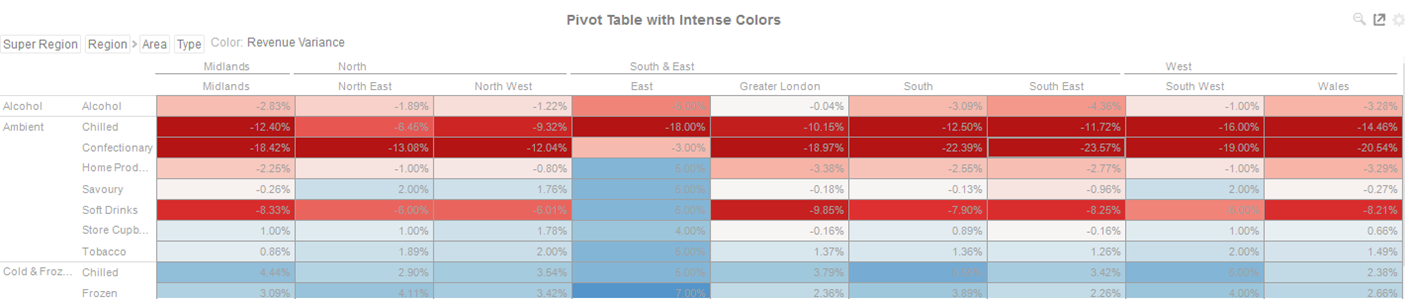
Figure 2. A pivot table with intense colors