


|
CountDistinct
Creates numeric aggregated variables based on the distinct count of text columns.
Given this data table:
|
Country |
Industry |
Product |
Company |
1 Day Change % (USD) |
Mcap(USD) |
| AT | Financials | Charleston | Raiffeisen International Bank-Holding AG |
-0.07 |
3439883100 |
| AT | Financials | Soflyy | Raiffeisen International Bank-Holding AG |
-0.07 |
1371987780 |
| AT | Basic Materials | Digital 2TB | Raiffeisen International Bank-Holding AG |
-0.03 |
1412883878 |
| AT | Industrials | Charleston | Wienerberger AG |
-0.04 |
660942066 |
| AU | Basic Materials | Charleston | BHP Billiton Ltd. |
-0.06 |
74380605994 |
| AU | Basic Materials | Soflyy | Lihir Gold Ltd. |
0.02 |
5377974426 |
| AU | Basic Materials | Soflyy | BHP Billiton Ltd. |
-0.02 |
2104618718 |
| BE | Financials | Digital 2TB | KBC Group N.V. |
-0.05 |
2369136539 |
| BE | Financials | Charleston | Dexia S.A. |
-0.09 |
2272408744 |
| BE | Basic Materials | Soflyy | KBC Group N.V. |
0.04 |
4151907147 |
| BE | Basic Materials | Digital 2TB | Umicore S.A. |
-0.03 |
2078266946 |
| CA | Consumer Goods | Canbio HD | Magna International Inc. Cl A |
-0.05 |
2981991456 |
| CA | Financials | Wraith Tri | Canadian Imperial Bank of Commerce |
-0.03 |
13960011146 |
Country, Industry, Product and Company are text columns while 1 Day Change % (USD) and Mcap(USD) are numeric columns.
Sample 1
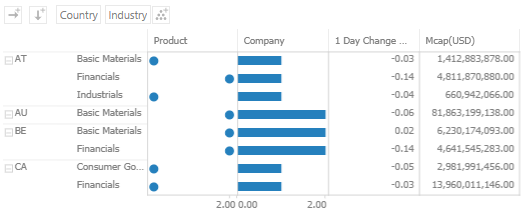
Below is the defined breakdown in a Table visualization:
This Table visualization is showing the grouping of the columns based on the breakdown hierarchy with Product, Company, 1 Day Change % (USD), and Mcap(USD) as Visual Members and with the corresponding aggregates:
|
Column |
Aggregate |
|
Product |
TextUnique |
|
Company |
TextUnique |
|
1 Day Change % (USD) |
Sum |
|
Mcap(USD) |
Sum |
By default, the aggregates of Product and Company are both set to TextUnique.
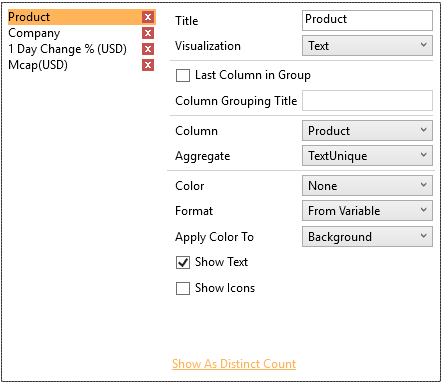
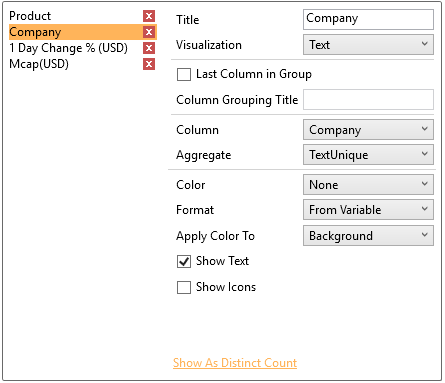
The Table visualization now displays the distinct text values of Product and Company for the breakdown columns, Country and Industry.
|
Product |
Company |
1 Day Change % (USD) |
Mcap(USD) |
||
| AT
|
Basic Materials | Digital
2B
|
Raiffeisen International Bank-Holding AG |
-0.03 |
1412883878 |
| Financials | Raiffeisen International Bank-Holding AG |
-0.14 |
4811879880 |
||
| Industrials | Charleston | Wienerberger AG |
-0.04 |
660942066 |
|
| AU | Basic Materials |
-0.06 |
81863199138 |
||
| BE | Basic Materials |
-0.02 |
6230174093 |
||
| Financials |
-0.14 |
4641545283 |
|||
| CA | Consumer Goods | Canbio HD | Magna International Inc. Cl A |
-0.05 |
2981991456 |
| Financials | Wraith Tri |
Canadian Imperial Bank of Commerce |
-0.03 |
13960011146 |
|
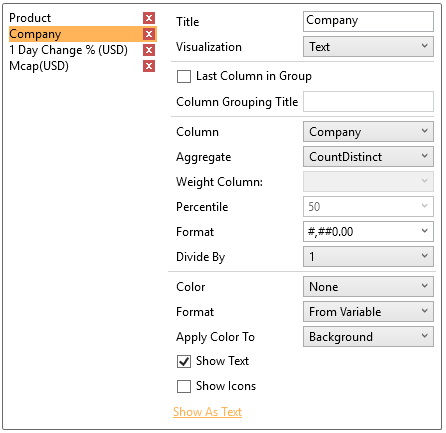
To display the Product column as a distinct count, click Show as Distinct Count. The dialog changes to show numeric properties with the Aggregate set to CountDistinct:
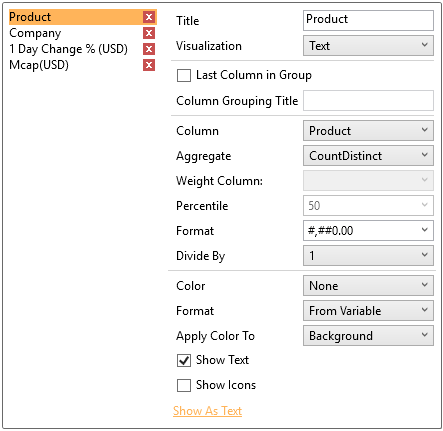
The values of the Product column display in the Table as:
|
Product |
Company |
1 Day Change % (USD) |
Mcap(USD) |
||
| AT
|
Basic Materials |
1.00 |
Raiffeisen International Bank-Holding AG |
-0.03 |
1412883878 |
| Financials |
2.00 |
Raiffeisen International Bank-Holding AG |
-0.14 |
4811879880 |
|
| Industrials |
1.00 |
Wienerberger AG |
-0.04 |
660942066 |
|
| AU | Basic Materials |
2.00 |
-0.06 |
81863199138 |
|
| BE | Basic Materials |
2.00 |
-0.02 |
6230174093 |
|
| Financials |
2.00 |
-0.14 |
4641545283 |
||
| CA | Consumer Goods |
1.00 |
Magna International Inc. Cl A |
-0.05 |
2981991456 |
| Financials |
1.00 |
Canadian Imperial Bank of Commerce |
-0.03 |
13960011146 |
|
For example, for the Country AT and Industry Financials, it shows that there are 2 Product distinct counts for the breakdown columns which are: Charleston and Soflyy
While for the Country AU and Industry Basic Materials, there are 2 Product distinct counts for the breakdown columns which are also: Charleston and Soflyy
You can also opt display the Company column as a distinct count by clicking Show as Distinct Count. The dialog changes to show numeric properties with the Aggregate set to CountDistinct:
The values of the Company column display in the Table as:
|
Product |
Company |
1 Day Change % (USD) |
Mcap(USD) |
||
| AT
|
Basic Materials |
1.00 |
1.00 |
-0.03 |
1412883878 |
| Financials |
2.00 |
1.00 |
-0.14 |
4811879880 |
|
| Industrials |
1.00 |
1.00 |
-0.04 |
660942066 |
|
| AU | Basic Materials |
2.00 |
2.00 |
-0.06 |
81863199138 |
| BE | Basic Materials |
2.00 |
2.00 |
-0.02 |
6230174093 |
| Financials |
2.00 |
2.00 |
-0.14 |
4641545283 |
|
| CA | Consumer Goods |
1.00 |
1.00 |
-0.05 |
2981991456 |
| Financials |
1.00 |
1.00 |
-0.03 |
13960011146 |
|
Note that for the Country AT and Industry Financials, there are 2 Product distinct counts but only 1 Company distinct count which is Raiffeisen International Bank-Holding AG.
This aggregation method is initially implemented for the following:
-
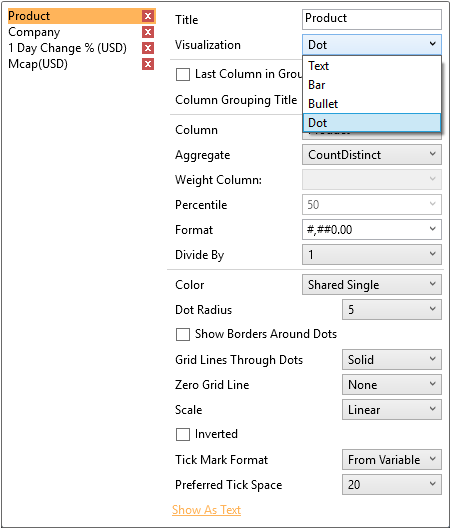
Ticker Tile, Bar, Dot, and Bullet visualizations
For example:
-
Height, Size, and Details variables
For the Details variable, dragging a text column to the Details shelf creates a text details member.
To show as distinct count, open the Details variable settings and click Show as Distinct Count.
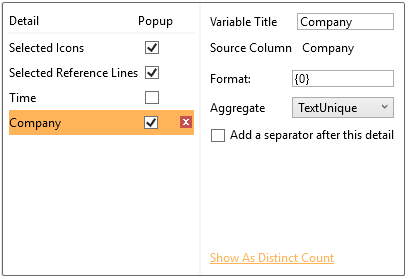
The settings now display numeric properties.
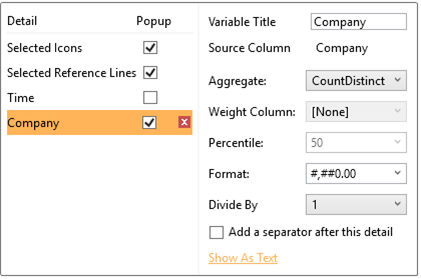
Click Show As Text to revert to text details.