


|
Circle Pack
Circle Packs represent hierarchical data sets, showing both each level in the hierarchy and how they interact with each other. They are consequently used for identifying patterns of performance, and outliers within peer groups.
They are represented by a colorful mosaic of enclosed circles based on your data. The size of a circle reflects its importance. The color conveys urgency or variance.
Circle Packs can also be cross tabbed, and offer an alternative to the Heat Matrix, with the added benefit of having both a size (typically relating to importance), and a color variable (typically related to performance variance).
Most people can learn to understand the information presented in a Circle Pack in under a minute – even if that Circle Pack is showing data representing an underlying data set of thousands of records.
A recommended alternative to the Circle Pack is the Treemap, which can display a larger number of data points, and is easier to compare constituent data points.
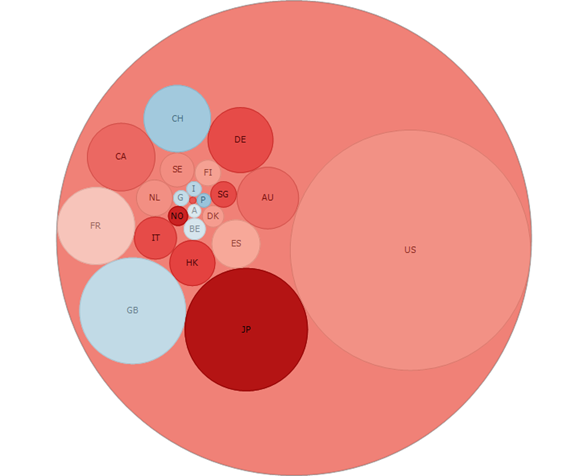
Figure 1. A flat Circle Pack –Showing Outer Circle with aggregate color.
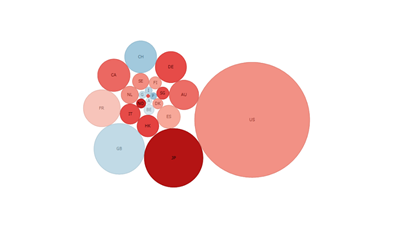
Figure 2. A flat Circle Pack –Hiding Outer Circle.
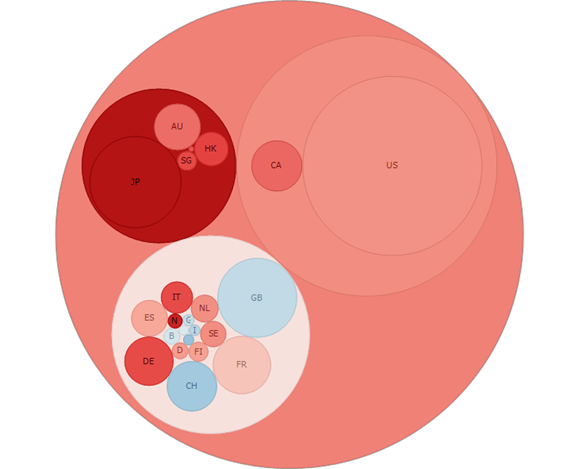
Figure 3. A Hierarchical Circle Pack –Showing Outer Circle.
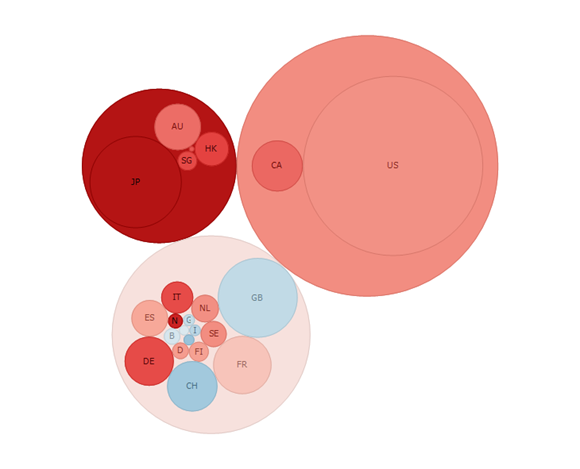
Figure 4. A Hierarchical Circle Pack – Hiding Outer Circle.
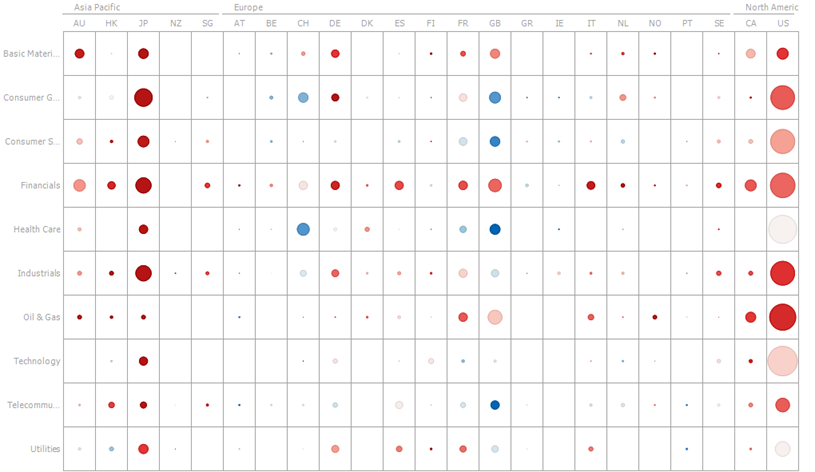
Figure 5. A Cross Tabbed Circle Pack – Showing Correlation of Industries to Countries