


|
Box Plot
Box Plots are designed to display numeric distributions.
The plot draws the Minimum, 25th Percentile, Median, 75th Percentile, and Maximum of the specified measure by category.
This can be provided as a single measure, where Panopticon performs the aggregation.
Or as separate measures for each component of the box plot, where the data source performs the aggregation.
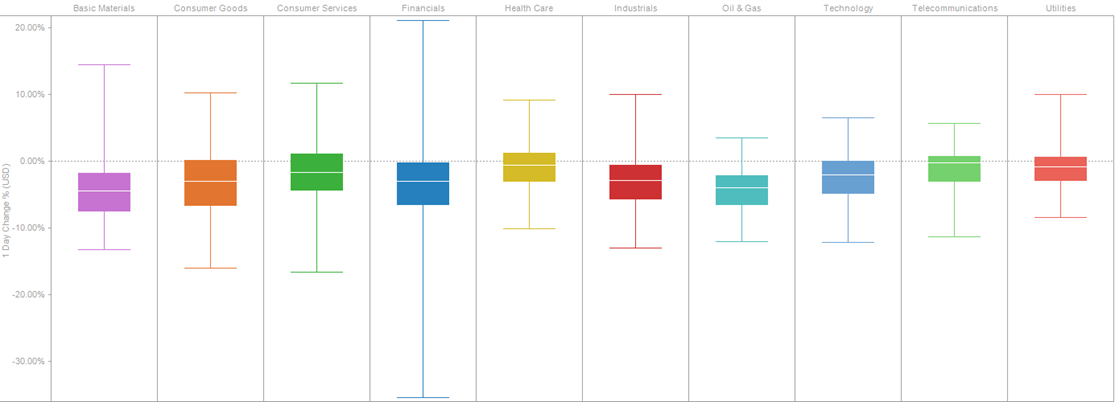
Figure 1. A Box Plot of Price Performance Distributions by Industry