


|
Adding a Shape Legend
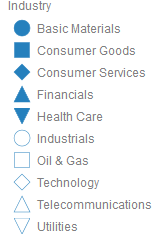
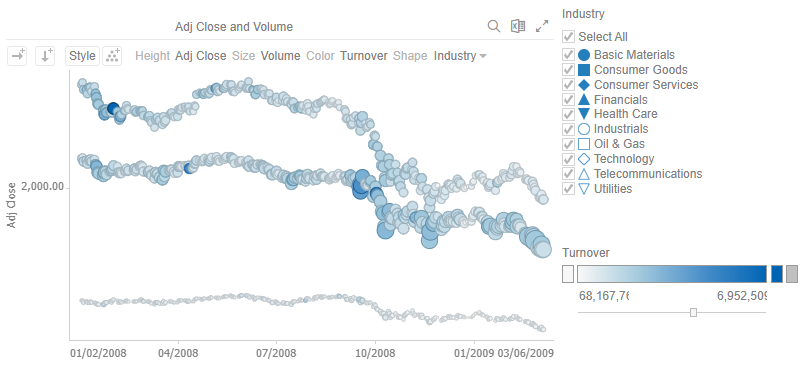
Shape Legend displays the shape variables of the associated visualization (Scatter Plot, Table, Timeseries Combination, and Timeseries Scatter Plot). You can also set the orientation or enable the ability to do a filter or to display it in the PDF output.
Adding a Shape Legend
-
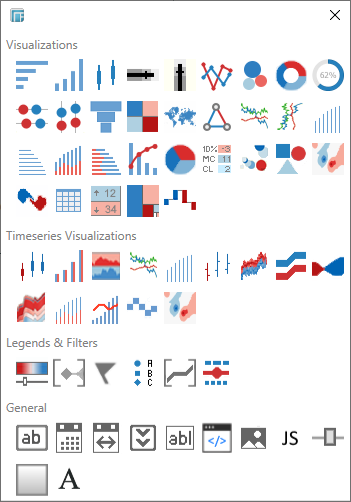
Draw a rectangle on the dashboard canvas to display the Parts dialog.
-
Click the Shape Legend
 icon in the Legends
& Filters section of the Parts
dialog.
icon in the Legends
& Filters section of the Parts
dialog.
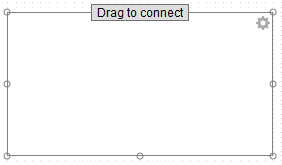
The Shape Legend part is displayed in the Dashboard canvas. Be default, it appears empty.
-
Select the shape legend.
-
The Drag to Connect icon will appear at the top of the legend.
-
-
Click on Drag to Connect and drag to the desired parent visualization. Release the mouse.
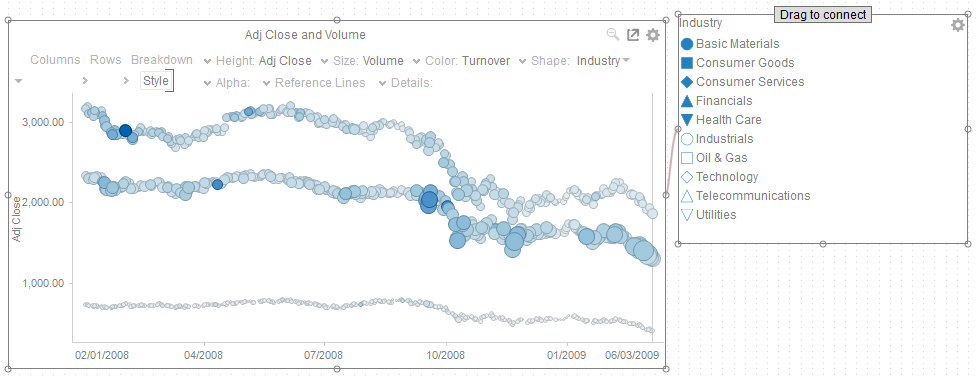
The Shape Legend is now connected to its parent visualization. It will retrieve the shape variables from the visualization and display them in the legend.
The link between the legend and parent visualization is visible in the Panopticon Designer (Desktop). You can change this and connect to a different visualization by re-doing the Drag to Connect step.
-
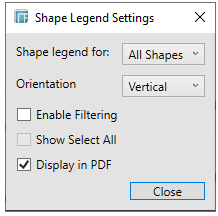
To access the Shape Legend Settings, click the Settings
 icon.
icon.
-
You can either set the shape legend to All Shapes or to a specific source column.
-
For Text shape legends, you can display them either:
-
-
Vertically
-
-
-
Horizontally
-

-
You can also enable filtering and allow selection of all items (Show Select All):
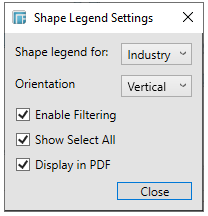
NOTE: Filtering is only supported in the web client.
-
Check the Display in PDF box to include this dashboard part in the PDF output.