|
Setting Snapshot Time in a Time Series Visualization
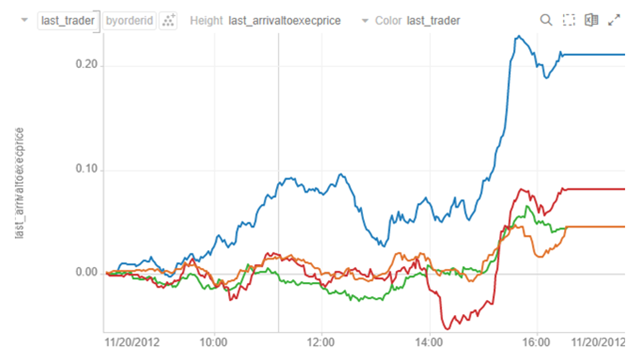
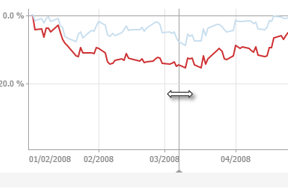
A time series visualization consists of a series of time slices, within a defined time window. The snapshot time identifies a particular slice, which can be highlighted further in separate visualizations.
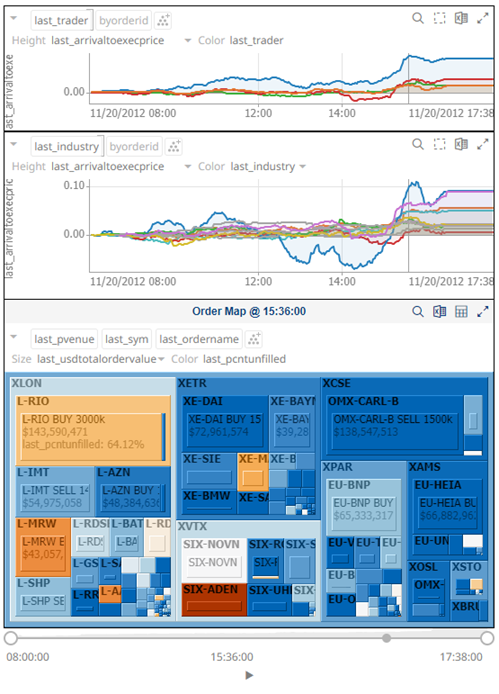
The snapshot is highlighted on the time series visualization through the aid of a vertical grid line.
The snapshot can be selected to focus on particular spikes or abnormalities in the data through either:
q Moving the snapshot on the time filter
q Right-clicking on the graph, and selecting Set snapshot here
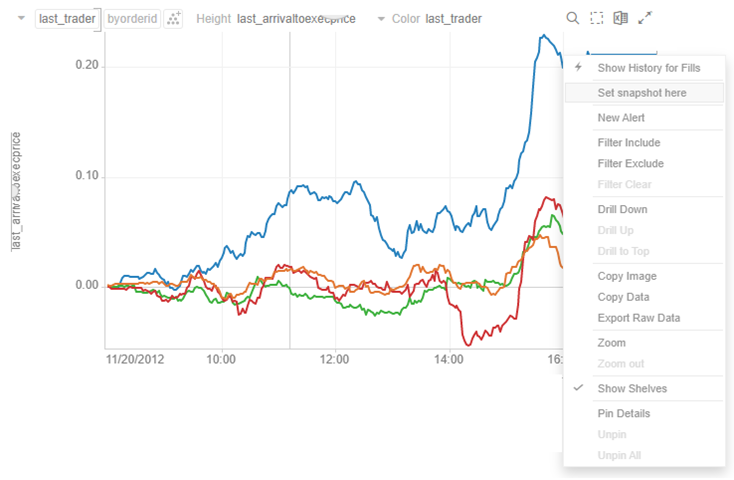
The snapshot will be set for the selected time.
Setting the snapshot can also be displayed on the associated Time Filter Box of a time series visualization.
You can also drag the snapshot line anywhere in the visualization. Hover your mouse on the snapshot line and move it either to the left or to the right.
|
NOTE |
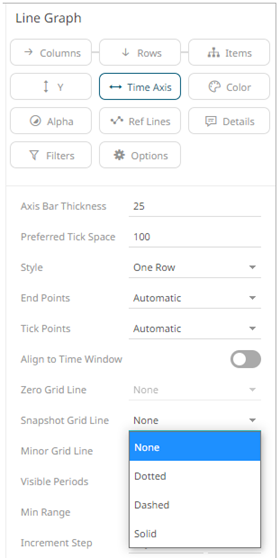
The Set Snapshot Here option is only available in the time series visualization context menu when the Snapshot Grid Line is rendered or set to Dotted, Dashed, or Solid in the Time Axis variable.
|