|
Rubber Band Zoom and Selection
Rubber Band Selection allows multiple items to be selected or lassoed by defining an area with the mouse. When selected, the mouse pointer is displayed as a crosshair. Clicking and dragging the mouse defines the selected area in grey. Once confirmed the selected items are highlighted. This selection option is available in the Network Graph visualization.
|
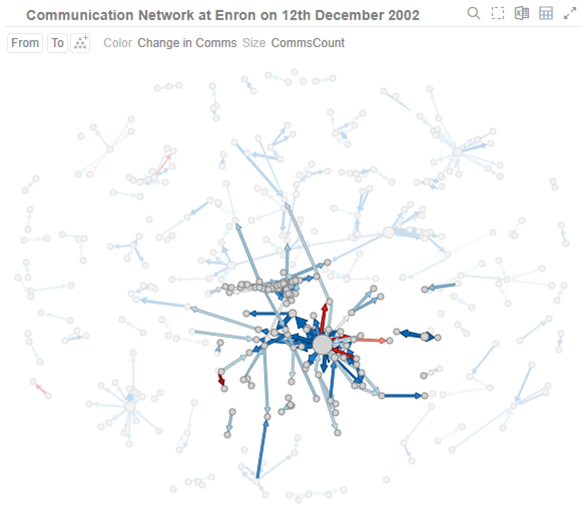
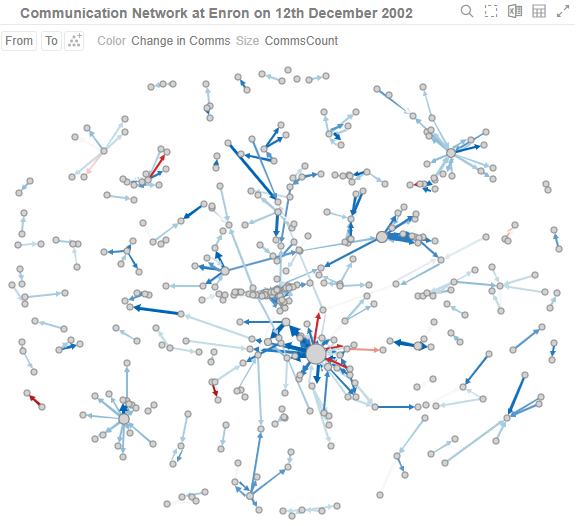
Before |
Before selection
Click
the Rubber Band Selection |
|
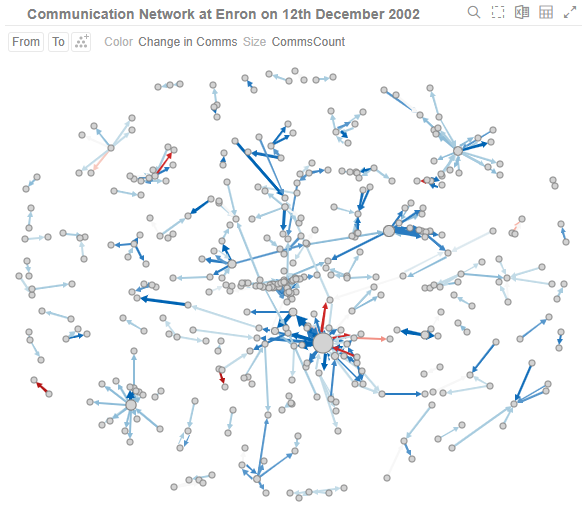
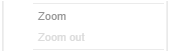
During Mouse pointer has been dragged to define an area of interest. |
During selection
|
|
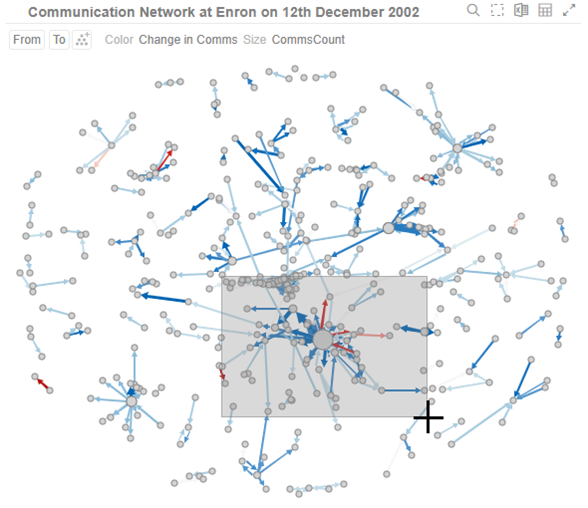
After The selected items are highlighted.
|
After selection
To unselect, click on any part of the visualization. |


Rubber Band Zoom is supported for visualizations that have:
q Numeric X and Y axes
q Date/Time X and Y axes
These are Candle Stick, Line Graph, Needle Graph, Network Graph, Numeric Line Graph, Numeric Needle Graph, Numeric Stacked Needle, OHLC Graph, Order Book, Price Band, Scatter Plot, Spread Graph, Stacked Needle Graph, Timeseries Combination, and Timeseries Scatter Plot visualizations.
|
NOTE |
When the cross tab consists of two Text axes, Rubber Band Zoom is not available.
|
|
Before |
Before zooming
You can either: · select Zoom in the context menu, or
· click
the Rubber Band Zoom The
mouse turns into a crosshair |
|
During Mouse pointer has been dragged to define an area of interest. |
During selection for zooming
|
|
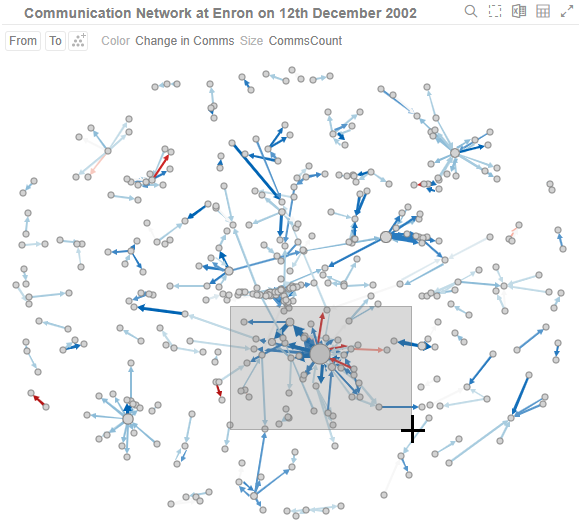
After Selected
items is zoomed in and the Zoom Out
|
After zooming
To revert to the original state of the visualization you can either: q click the Zoom Out q select Zoom Out in the context menu
|
 icon
on the header control
icon
on the header control
 icon
has is displayed.
icon
has is displayed.
 icon
at the top right of the visualization
icon
at the top right of the visualization