


|
Kx kdb+
The Kx kdb+ input data source allows connection to the Kx kdb+ databases on a polled basis.
Steps:
1. Select Kdb+ from the Data Sources pane. The Kdb+ Settings pane and the retrieved Kdb+ source are displayed.
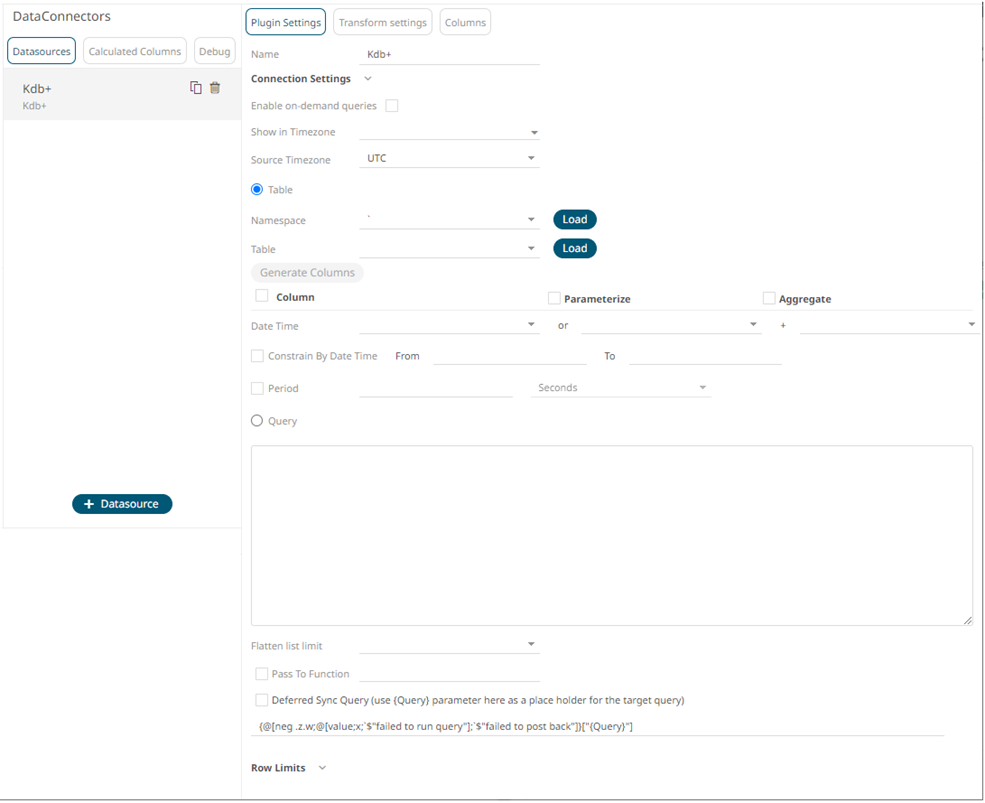
2. Enter the Name of the Kx kdb+ data source, then
click  .
.
3. Click Connection Settings to expand and display the properties you can set.
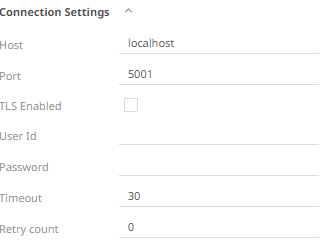
4. Enter the following properties:
|
Property |
Description |
|
Host |
Kx kdb+ host address. |
|
Port |
Kx kdb+ host port. Default is 5001. |
|
TLS Enabled |
Ensure to check if you have started q with TLS only. |
|
User Id |
The user Id that will be used to connect to Kx kdb+. |
|
Password |
The password that will be used to connect to Kx kdb+. |
|
Timeout |
The length of time to wait for the server response in seconds. Default is 30. |
|
Retry Count |
Number of connection attempts to be done that can be used for busy Kx kdb+ servers. Default is 0. |
|
NOTE |
Host, Port, User Id, and Password can be parameterized.
|
5. Check/uncheck the Enable on-demand queries box. See On-Demand Queries for more information.
6. You can opt to define the Show in Timezone and Source Timezone settings.
|
NOTE |
The time zone transformation is not applied to Date columns.
|
7. Check the Constrain by Date Time box, and enter From and To Date/Time constraints that are assumed to be in this time zone for incorporation into the query.
If the query is to filter/constrain the results on Date/Time, the constrain sections are completed.
8. When Table is selected, the section below is enabled:
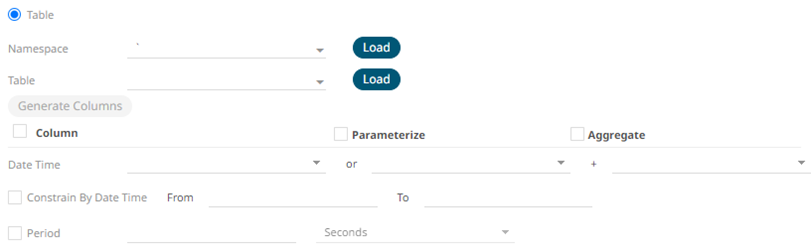
The Namespace drop-down is an editable combo box.

You can either:
· click  and select a namespace
from the list of all root level namespaces. By default, the selected
namespace will be root (backtick `).
and select a namespace
from the list of all root level namespaces. By default, the selected
namespace will be root (backtick `).
· For nested namespaces, enter them in the Namespace box (e.g., panopticon.test) to get the tables that were created under these namespaces.
9. On the Table field, click to
populate the drop-down list with tables and views. Select a table
or view.
10. Click  . The columns of the selected table or view populates
the Output Column section.
. The columns of the selected table or view populates
the Output Column section.
11. Individual columns can be added by checking the corresponding Column box in the Output Column listing.
12. If the data returned is to be aggregated, then the Aggregate checkbox should be selected. For each selected column, the possible aggregation methods are listed including:
· Text Columns: Group By
· Date Columns: Count, Min, Max, Group By
· Numeric Columns: Sum, Count, Min, Max, Group By
In addition, the qSQL query is generated and displayed on the Query text box.
13. Check the Parameterize checkbox and match the parameter to the appropriate column. By default, they will be matched by name.
The appropriate qSQL query is updated on the Query text box.
14. If the data is to be filtered or aggregated on Date/Times, then a valid Date Time field needs to be selected from either a single Date/Time field, or a compound column created from a selected Date and a selected Time column.

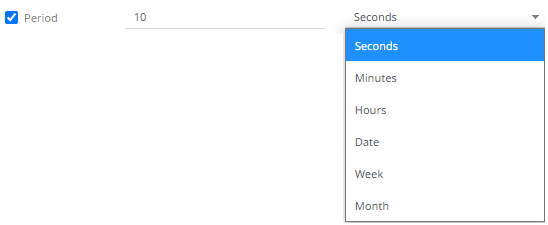
15. In kdb+, you can modify the query to regroup the aggregated data per time units (i.e., Seconds, Minutes, Hours, Date, Week, Month). Check the Period box, enter the time duration and click then select the time unit.
16. Enter a qSQL query language into the Query text box.
If a parameter has been defined, the qSQL entry can refer to it.
17. Select the Flatten List Limit.
This allows retrieval of the first ‘n’ items in the list and produce new columns in the output schema with a dot notation.
For example, if there are two nested fields (BidPrices and OfferPrices) and the flatten list limit selected is five, then the output schema will be:
BidPrices.1, BidPrices.2, BidPrices.3, BidPrices.4, BidPrices.5, OfferPrices.1, OfferPrices.2, OfferPrices.3, OfferPrices.4, OfferPrices.5
If there are less than five items in the list, then the values will be null.
|
NOTE |
Currently, this feature works for the Service subscription type. Also, it only flattens numeric columns.
|
18. Check Pass to function box to activate a connection to a server using a proxy. Enter the value.
19. You may also define a Deferred Sync Query.
20. Set the row limit of the data set.
21. Tap the Preview Selected Data Source slider to turn it on.
22. Click  to display the data preview.