|
Example 1
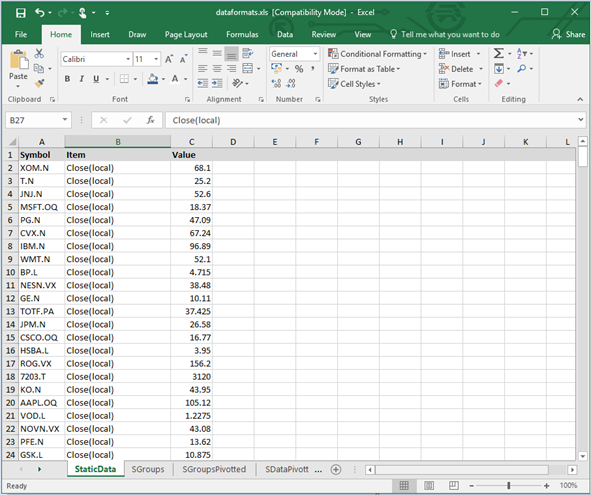
A common format for database sourced data is key value pairs. As an example, below; price changes are listed as key value pairs for a set of symbols.
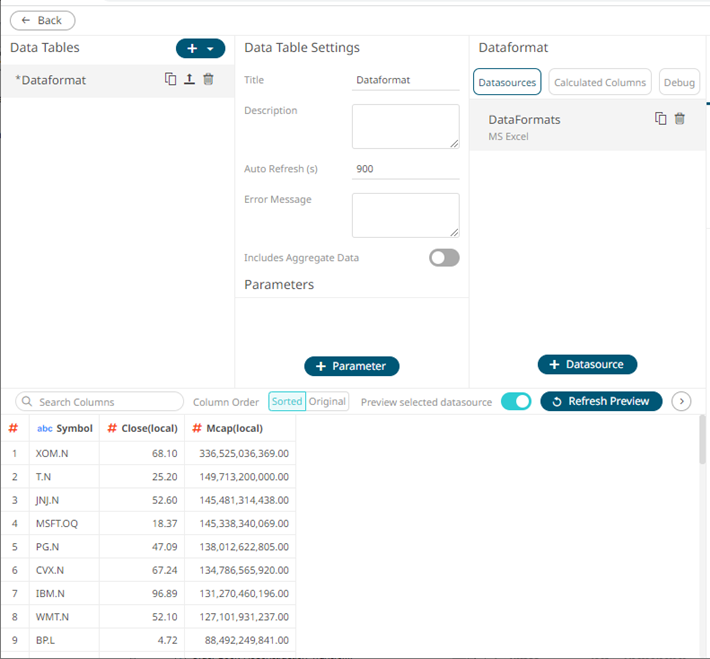
When retrieved, the data table preview displays the same key value pair layout.
Steps:
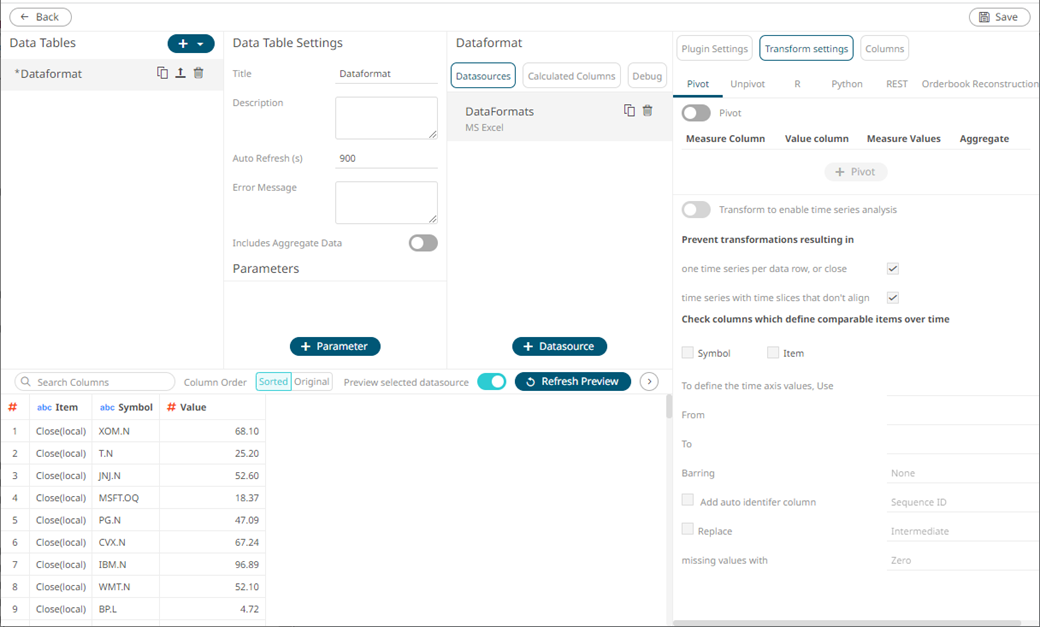
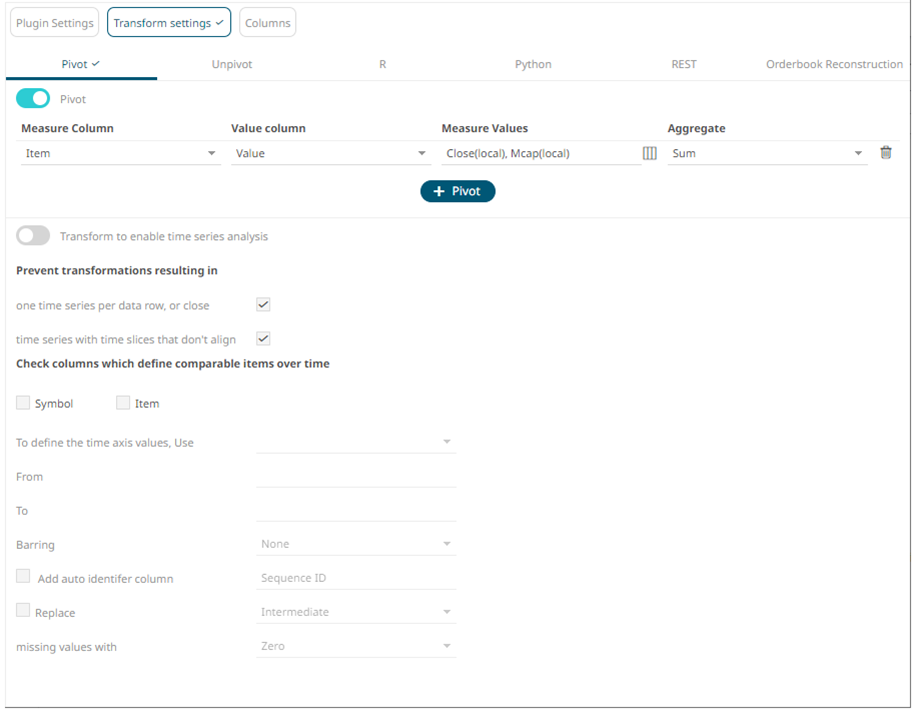
1. To pivot the data, click the Transform Settings button on the Data Sources Setting pane.
The Transform Settings pane displays.
2. Tap the Pivot slider to turn it on.
The Transform Settings
button and Pivot tab change to  and
and
 ,
respectively.
,
respectively.
3. Click  .
.
4. Select the Measure Column. This is the column that will be pivoted.
5. Select the Value Column.
6. For the Measure Values, you can either:
· enter the possible values of the selected Measure Column, or
· click Populate Measure Values  button
to populate the text box.
button
to populate the text box.
|
NOTE |
The
Populate Measure Values
|
These values will become the output columns of the pivot data transform.
7. Select the Aggregate method for the value column.
8. Click  .
.
For example:
Measure Column = Item
Value Column = Value
Measure Values = Close(local), Mcap(Local)
Aggregate= Sum
All columns that are not the Measure or Value columns will be removed from the output data structure.
The preview is updated to show the pivoted layout, which in the case below now shows each change as a separate data column. These pivoted results are additionally available as input into calculated columns.