


|
Network Graph Settings
A Network Graph displays relationships between entities and can be used to identify correlations or flows between items.
The Network graph supports a two-level breakdown defining the “From”, and “To”, where each node (vertex / point), is either in the “From”, or “To” levels of the breakdown, and each edge (or line), represents the data specific to this “From à To” relationship.
The size of the node is specific to the number of interactions / relationships it has with other nodes. There can be up to two lines connecting two nodes, which can display arrows to show direction; and represent the “From à To” combinations. E.g. A à B, and B à A. Each line can also be colored to map to a numeric variable.
Customers use network graphs for investigating correlations, transactional flows, latency, and throughput bottlenecks.
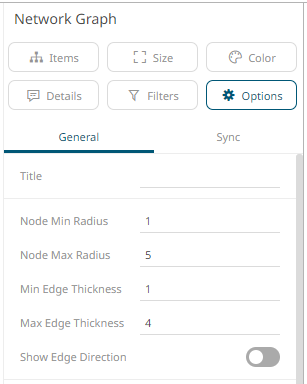
The network
graph settings pane is displayed after clicking the Options  button.
|
Setting |
Description |
|
Node Min Radius |
The minimum radius of each node. |
|
Node Max Radius |
The maximum radius of each node. |
|
Min Edge Thickness |
The minimum thickness of each edge that represents the connection between nodes. |
|
Max Edge Thickness |
The maximum thickness of each edge that represents the connection between nodes. |
|
Show Edge Direction |
Whether to display the direction of the edges. |