


|
Heat Matrix Settings
A Heat Matrix is similar to both the Heat Map and Treemap in that it displays many different data items and represents the value for each item using colors. However, unlike its cousins, the Heat Matrix has a defined structure where two data attributes define each axis, thus producing a correlation matrix. Within the Heat Matrix, each column and row represent a unique attribute, and the point where two items intersect represents a unique combination of the two attributes.
The matrix can display labels within each intersecting tile or simply display color.
Our Heat Matrix data visualization helps our clients identify correlations within their data sets using an intuitive graphical display.
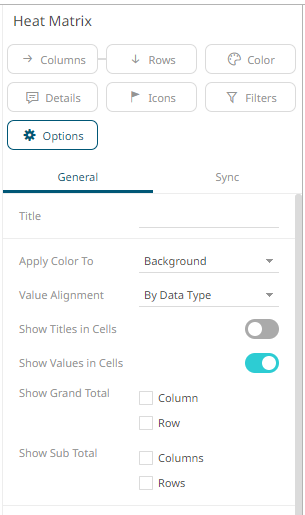
The heat matrix
settings pane is displayed after clicking the Options  button.
|
Setting |
Description |
|
Apply Color To |
Sets how the color variable is displayed: Background or Text. |
|
Show Titles in Cells |
Determines whether the field Title is shown in the cell. |
|
Show Values in Cells |
Determines whether |
This visualization also acts as a Pivot Table, like the current cross tabbed tile, with rows and columns. In addition, it is similar with the Table visualization as it displays row totals.
You can set these properties in the following controls:
|
Setting |
Description |
|
Show Grand Total Row |
Determines whether to display the grand total of the values of the Color and Detail variables on the X-axis (either as data in the cells or in the Pop-up). |
|
Show Sub Total Row |
Determines whether to display the sub totals of the values of the Color and Detail variables on the X-axis (either as data in the cells or in the Pop-up). |
|
Show Grand Total Column |
Determines whether to display the grand total of the values of the Color and Detail variables on the Y-axis (either as data in the cells or in the Pop-up). |
|
Show Sub Totals Column |
Determines whether to display the sub totals of the values of the Color and Detail variables on the Y-axis (either as data in the cells or in the Pop-up). |