|
Level
Returns the level in the hierarchy for the node or numbered from the leaf.
Given this data table:
|
Industry |
Supersector |
Symbol |
3 Month Change % |
|
Financials |
Banks |
ERST.VI |
-0.21 |
|
Basic Materials |
Basic Resources |
VOES.VI |
-0.35 |
|
Industrials |
Construction & Materials |
WBSV.VI |
-0.50 |
|
Health Care |
Health Care |
ICEL.VI |
0.06 |
|
Industrials |
Industrial Goods & Services |
ANDR.VI |
0.28 |
|
Financials |
Insurance |
VIGR.VI |
-0.10 |
|
Oil & Gas |
Oil & Gas |
OMVV.VI |
0.35 |
|
Telecommunications |
Telecommunications |
TELA.VI |
0.11 |
|
Utilities |
Utilities |
VERB.VI |
-0.12 |
|
Financials |
Real Estate |
ATRV.VI |
-0.12 |
|
Financials |
Banks |
BEN.AX |
-0.26 |
|
Financials |
Banks |
SUN.AX |
-0.28 |
|
Financials |
Banks |
NAB.AX |
-0.04 |
|
Financials |
Banks |
ANZ.AX |
-0.11 |
|
Financials |
Banks |
CBA.AX |
0.03 |
|
Basic Materials |
Basic Resources |
BSL.AX |
0.15 |
Sample 1
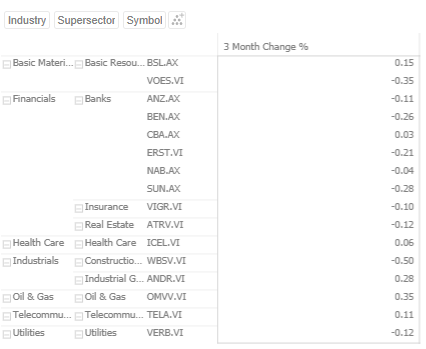
Below is the defined breakdown in a Table visualization:

The Levels will be:
|
Column |
Level |
|
Symbol |
0 |
|
Supersector |
1 |
|
Industry |
2 |
|
Root |
3 |
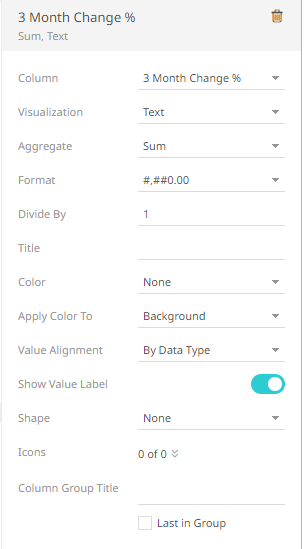
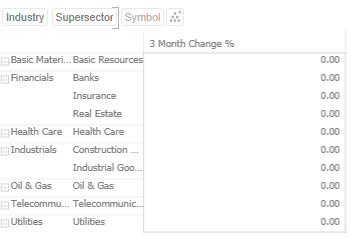
This Table visualization is showing the grouping of the columns based on the breakdown hierarchy with 3 Month Change %’s aggregate set to Sum.
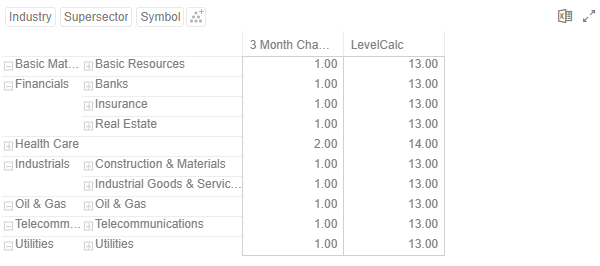
Changing the aggregate to Level and the format to #,##0.00 will produce this table since the Visible Depth is set until Symbol:
Sample 2
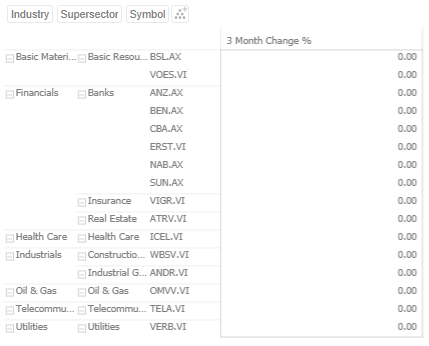
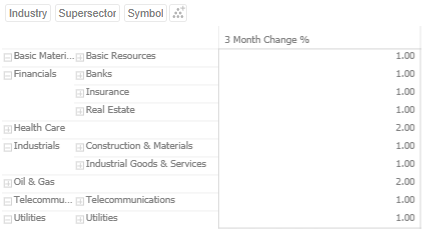
Clicking on Supersector will make the Symbol breakdown column invisible:
Sample 3
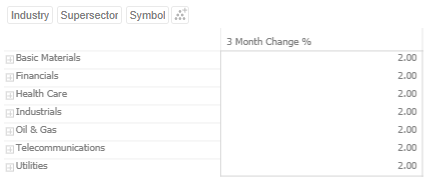
Collapsing columns in the table can also change the Level values:
Sample 4
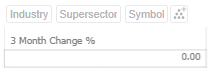
Clicking to the Root in the breakdown hierarchy:
The Level aggregate can also be used when creating calculated columns.
1. On the Edit Data Table layout page, click Calculated Columns and select Calculated.
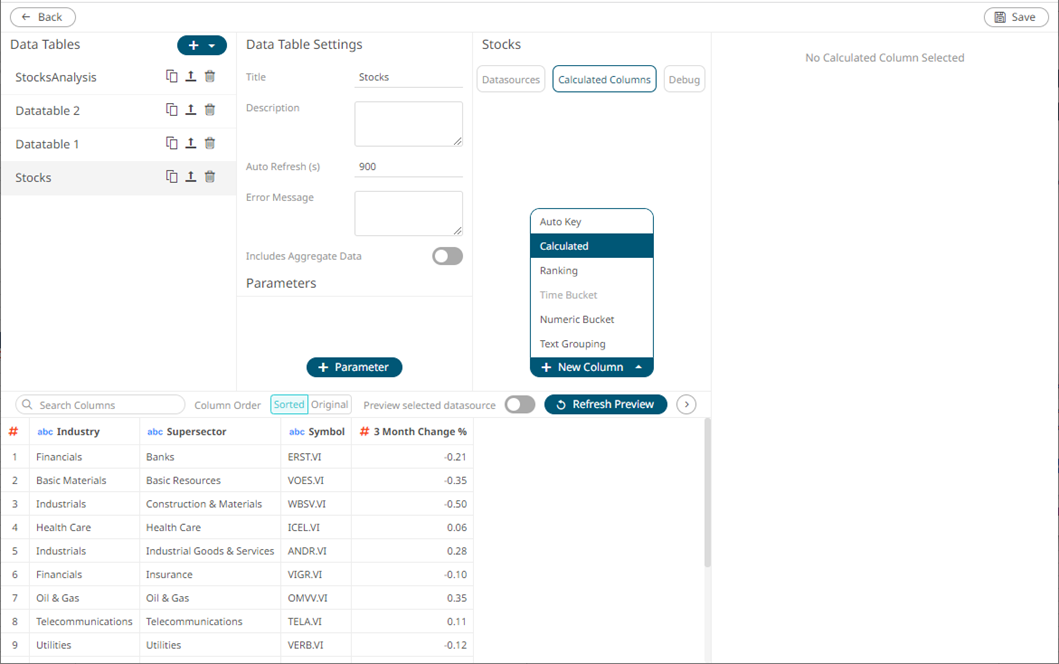
The Numeric Calculated Column pane displays.
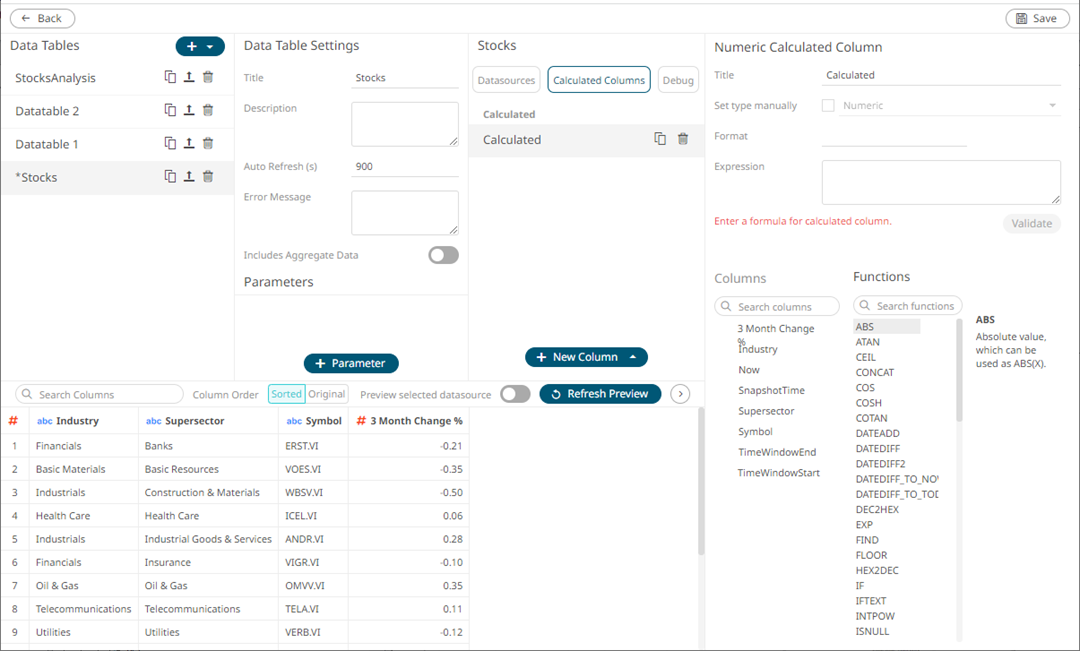
2. Build the expression with the Level aggregate.
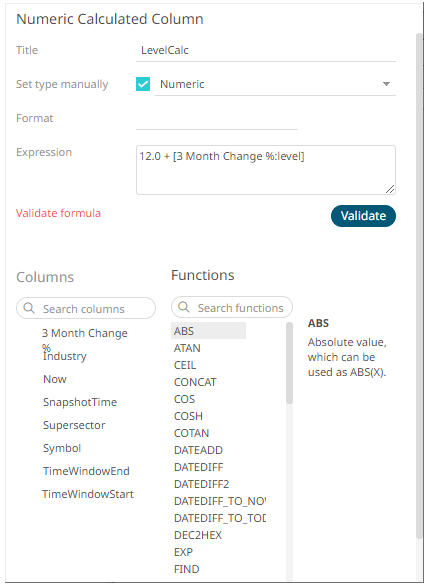
For example: 12.0 + [3 Month Change %:level]
When all of the levels are visible in the breakdown (Sample 1), the results will be:
|
Industry |
Supersector |
Symbol |
3 Month Change % |
LevelCalc |
|
Basic Materials |
Basic Resources |
BSL.AX |
0 |
12.0 |
|
|
|
VOES.VI |
0 |
12.0 |
|
Financials |
Banks |
ANZ.AX |
0 |
12.0 |
|
|
|
BEN.AX |
0 |
12.0 |
|
|
|
CBA.AX |
0 |
12.0 |
|
|
|
ERST.VI |
0 |
12.0 |
|
|
|
NAB.AX |
0 |
12.0 |
|
|
|
SUN.AX |
0 |
12.0 |
|
|
Insurance |
VIGR.VI |
0 |
12.0 |
|
|
Real Estate |
ATRV.VI |
0 |
12.0 |
|
Health Care |
Health Care |
ICEL.VI |
0 |
12.0 |
|
Industrials |
Construction & Materials |
WBSV.VI |
0 |
12.0 |
|
|
Industrial Goods & Services |
ANDR.VI |
0 |
12.0 |
|
Oil & Gas |
Oil & Gas |
OMVV.VI |
0 |
12.0 |
|
Telecommunications |
Telecommunications |
TELA.VI |
0 |
12.0 |
|
Utilities |
Utilities |
VERB.VI |
0 |
12.0 |
Collapsing columns in the table (similar with Sample 3 above) will result to: