|
Grouping Colums in the Table Visualization
Visual members of a Table visualization can be grouped into sections.
Steps:
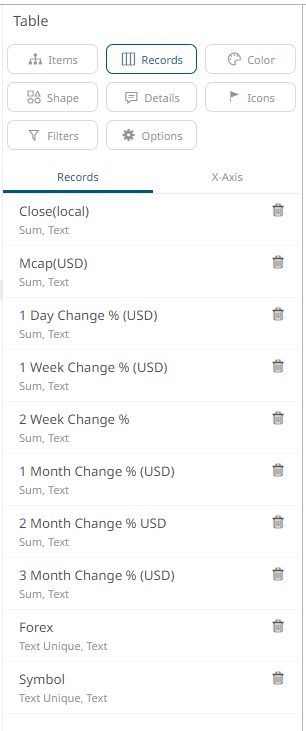
1. Open or create a Table visualization and add columns to the Records variable.
2. Click the Records variable drop area to display the available visual.
|
NOTE |
The inclusion of columns in a group will be based on their sequence in the Visual Members list.
|
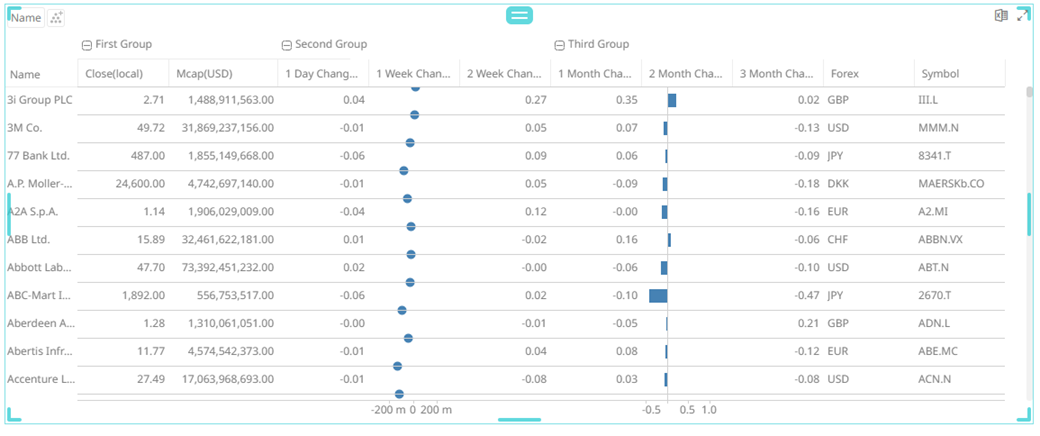
For example, the following groups will be created:
First group: Close(local) and Mcap(USD)
Second group: 1 Day Change % (USD), 1 Week Change % (USD), and 2 Week Change %
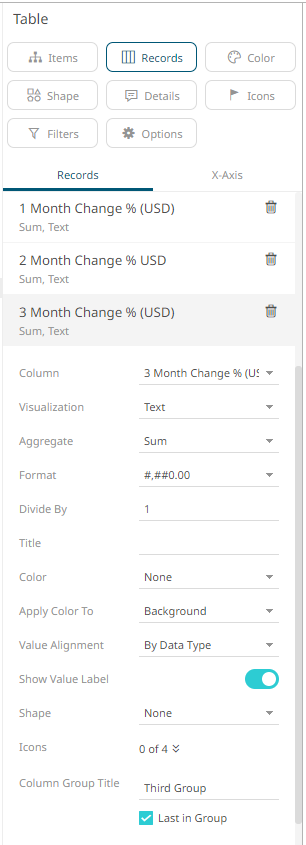
Third group: 1 Month Change % (USD), 2 Month Change % (USD), and 3 Month Change % (USD)
Forex and Symbol will not be included in any group.
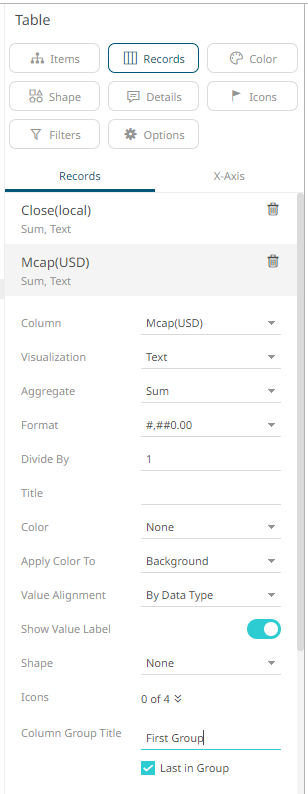
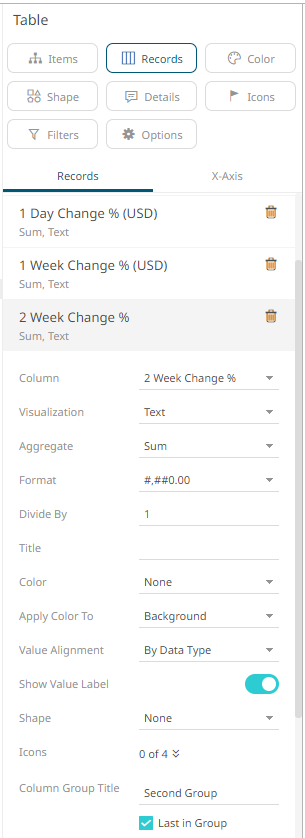
3. For the groupings, click the following
columns, check the Last in Group box, enter the Column Group
Title, and click  :
:
· First group: Mcap(USD)
· Second group: 2 Week Change %
· Third group: 3 Month Change % (USD)
The groupings are applied to the Table visualization.